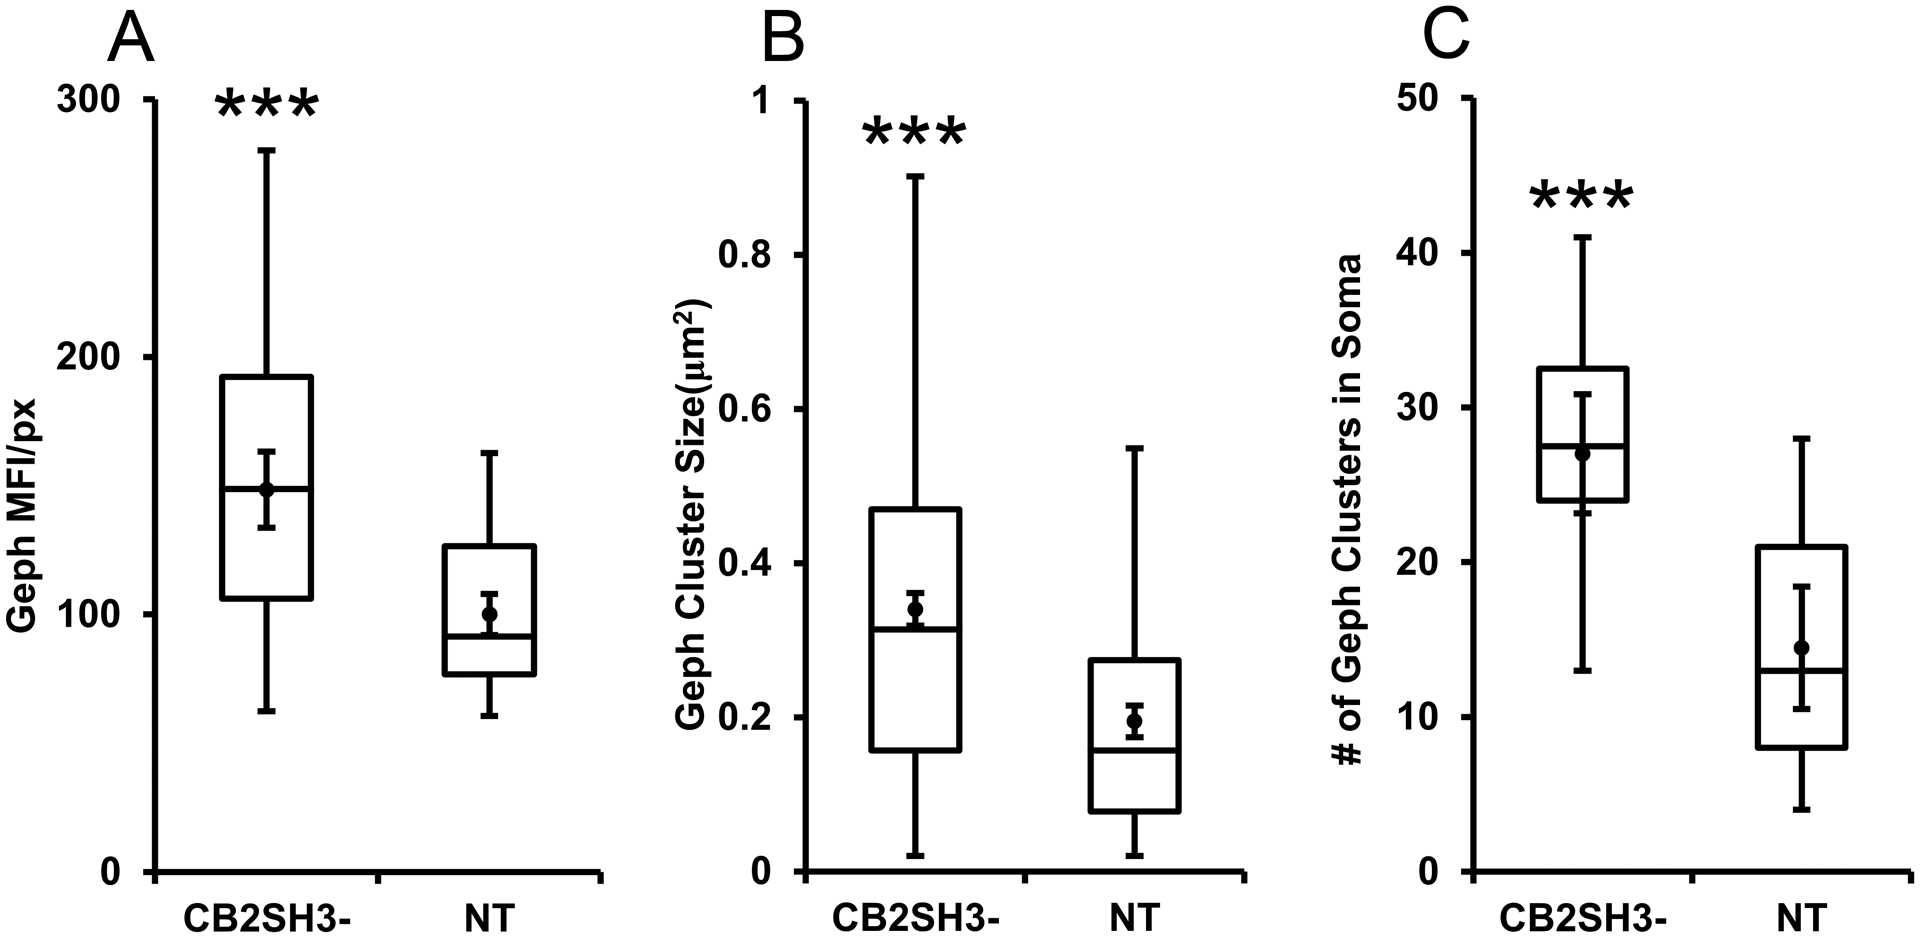
Figure 3. Quantification of the effect of CB2SH3− overexpression on gephyrin clusters.

The box plots display the median and interquartile range of the data while the whiskers represent the spread of the data within the 1.5 interquartile ranges of the upper and lower quartile. Inside the boxes, circles indicate mean and bars from mean indicate 95% confidence interval. (A) Mean fluorescence intensity per pixel of Geph immunofluorescence in CB2SH3− overexpressing neurons normalized to the corresponding mean value from sister non-transfected neurons at P44-P45. *** P < 0.001(Mann-Whitney U=728, n1=n2=56 neurons). (B) Size of Geph clusters in the somas of CB2SH3− overexpressing neurons compared to sister non-transfected controls*** P < 0.001(Mann-Whitney U=37,111 n1=486 clusters, n2=246 clusters). (C) Number of Geph clusters in the CB2SH3− overexpressing neurons compared to sister non-transfected controls*** P < 0.001(Mann-Whitney U=38 n1=18 neurons, n2=17 neurons) .
