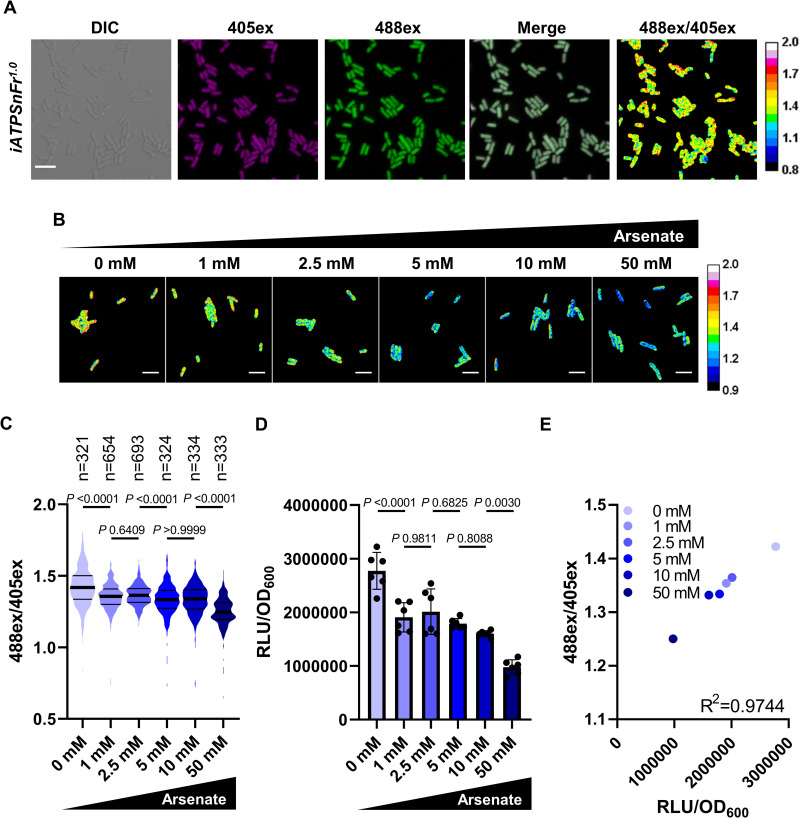
Fig 2. Expression and calibration of the ATP reporter iATPSnFr1.0 in E. coli.
(A) Representative images of an exponential culture of MG1655_iATPSnFr1.0 cultured in LB at 37°C. The fluorescent signals from 405ex and 488ex are false colored in magenta and green, respectively. In the ratiometric 488ex/405ex panel, orange/yellow cells correspond to cells with higher ATP, and blue cells with lower ATP. Scale bar, 5 μm. Observations were performed with a confocal microscope. (B) Representative ratiometric 488ex/405ex images of MG1655-SB1_iATPSnFr1.0 exponential cultures treated 30 minutes with different concentrations of arsenate. Scale bar, 5 μm. (C) Distribution of the iATPSnFr1.0 488ex/405ex ratio per single cell in exponential cultures treated with arsenate. Thick lanes represent the median, and secondary lanes the quartiles. Significance was determined using Kruskal–Wallis and Dunn’s multiple comparison tests. Data are representative of experiments made twice giving similar results. (D) Bulk ATP levels were measured in MG1655-SB1_iATPSnFr1.0 grown and treated with arsenate as in (B) and (C) with firefly luciferase assay and normalized with OD600. Data are the average results from 2 independent experiments performed with 3 biological replicates (n = 6). Error bars represent standard deviations. Significance was determined using one-way ANOVA and Tukey’s multiple comparison tests. (E) Calibration curve showing the correlation between single-cell and bulk measurements of ATP done in (C) and (D). Each data point represents the average of both single-cell and bulk measurements. Correlation was examined by Pearson’s correlation. The underlying data for this figure can be found in S1 Data.

