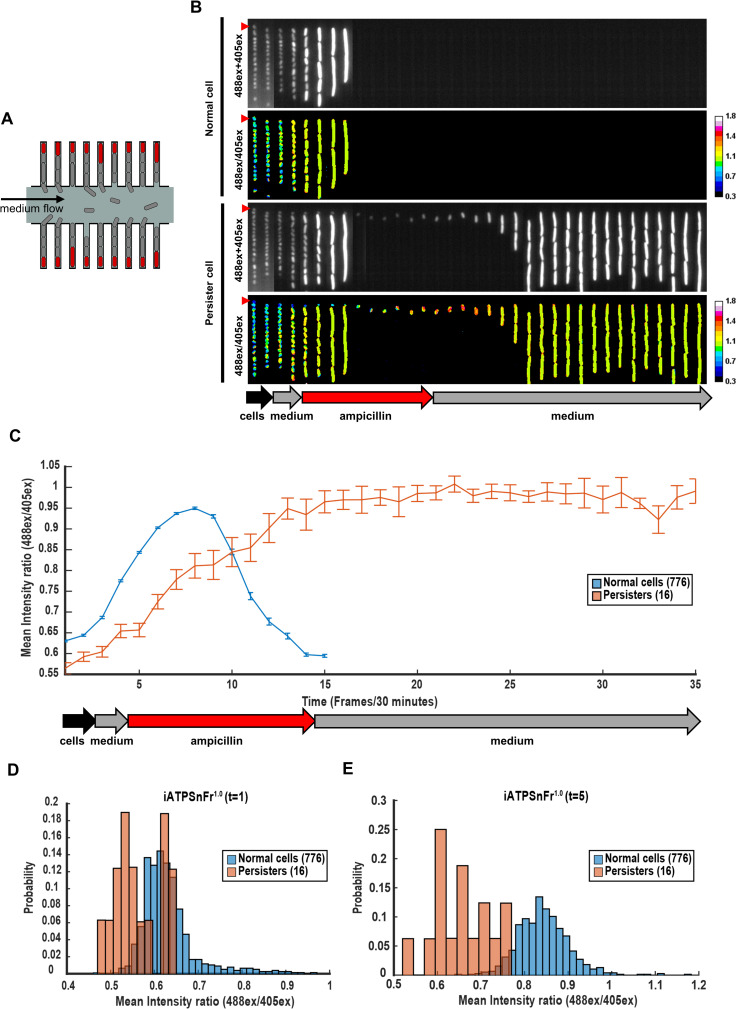
Fig 3. Persisters have lower ATP level than the rest of the population.
(A) Schematic of the mother machine device. Only mother cells (in red) at the end of each cell channel were tracked. (B) Kymographs of 2 single channels with MG1655-SB1_iATPSnFr1.0 cells over time. Stationary phase cells were concentrated and loaded in the device. The culture used to load the device was first flowed in the device for 1 hour (black arrow), followed by fresh EZRDM for 1 hour (grey arrow), by EZRDM + ampicillin (50 μg/mL) for 5 hours (red arrow), and finally by fresh EZRDM again (grey arrow). Frames were taken 30 minutes apart. The two upper panels represent the outcome of a mother cell that dies following ampicillin treatment. The two lower panels represent the outcome of a persister cell that survives ampicillin treatment. The 488ex+405ex panels represent the addition of iATPSnFr1.0 405ex and 488ex intensities. The iATPSnFr1.0 ratiometric 488ex/405ex panels represent ATP level. The mother cells analyzed are indicated with a red triangle. Observations were performed with a time-lapse epifluorescence microscope. (C) Data represented are the mean of the iATPSnFr1.0 488ex/405ex ratio per single cell over time frames (frames interval is 30 minutes). Error bars represent standard errors. (D) Distribution of the iATPSnFr1.0 488ex/405ex ratio per single cell for normal and persister cells at the first time frame of the time lapse (t = 1), and (E) immediately before the antibiotic is added (t = 5). The underlying data for this figure can be found in S1 Data.

