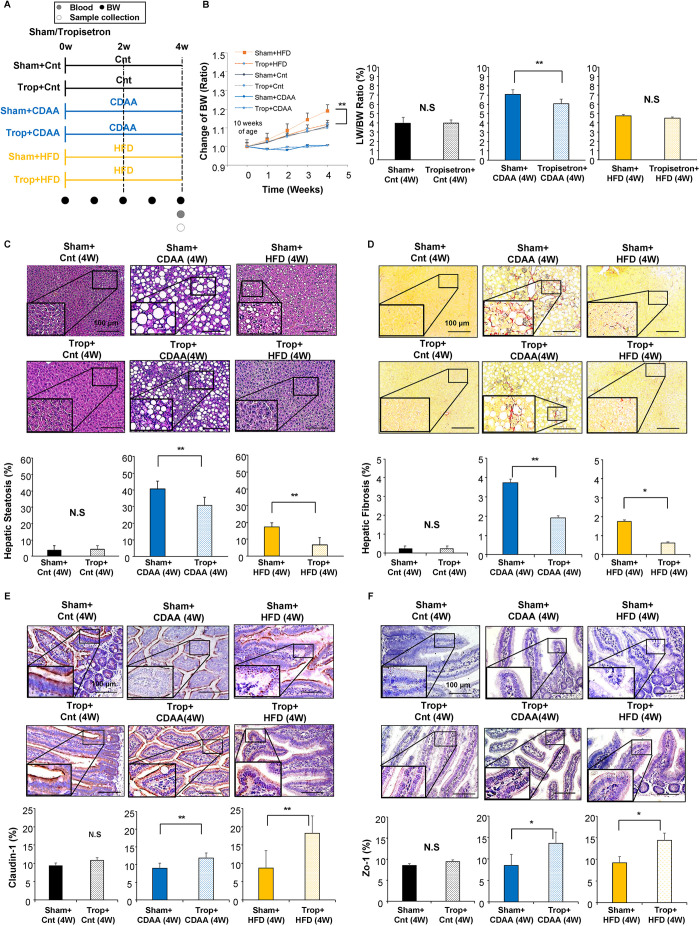
Fig. 5.
Effect of serotonin antagonist on NAFLD/NASH mice models. (A) Experimental design. The mice were divided into six groups (n=5 mice for each group). Trop, tropisetron. (B) Time-dependent change of BW. LW/BW ratio. (C-F) Representative images of H&E (C) and Sirius Red (D) staining of the livers, and Claudin-1 (E) and Zo-1 (F) staining of the small intestine of mice groups. Five different sections from each of the five mice (n=25) in all groups were quantitatively analyzed for fatty infiltration, fibrotic tissue and positively stained area using ImageJ software. Data are mean±s.d. *P<0.05; **P<0.01; N.S., not significant. Two-factor repeated measure ANOVA followed by Bonferroni's multiple comparison test (B); Paired two-tailed Student's t-test (C-F). Scale bars: 100 μm.

