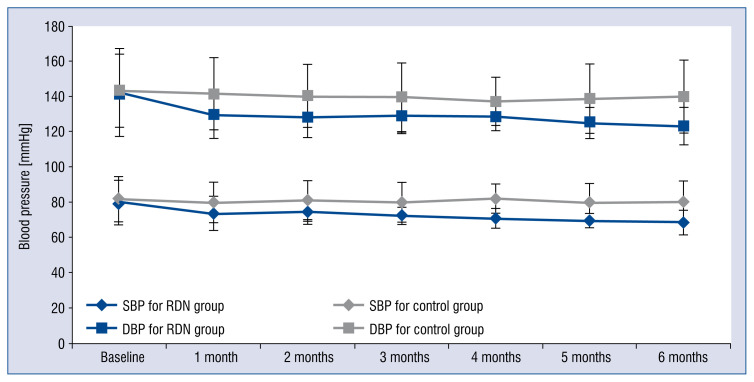
Figure 4.
Paired changes of systolic blood pressure (SBP) and diastolic blood pressure (DBP) before and after renal denervation (RDN) for RDN and control groups. Blood pressure was measured at baseline and over a 6 month follow-up. Significant reductions in blood pressure were observed in the RDN group over 6 months. Error bars indicate standard errors.

