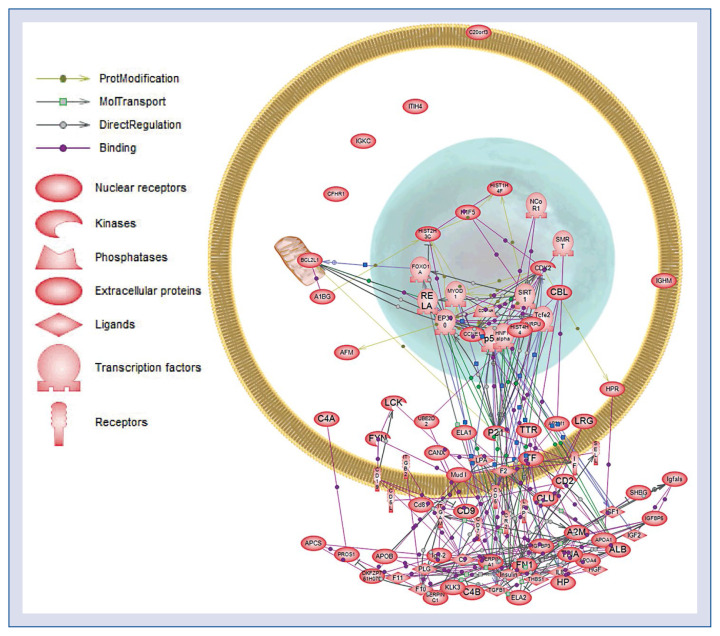
Figure 5.
Protein network of the identified proteins constructed using Pathway Studio 5.0. The differentially expressed proteins in Table 1 were imported into Pathway Assist, and an interaction model was generated using the shortest path algorithm. The legend of the interaction network is summarized on the right of the figure. Each node represents either a protein entity or a control mechanism of the interaction.

