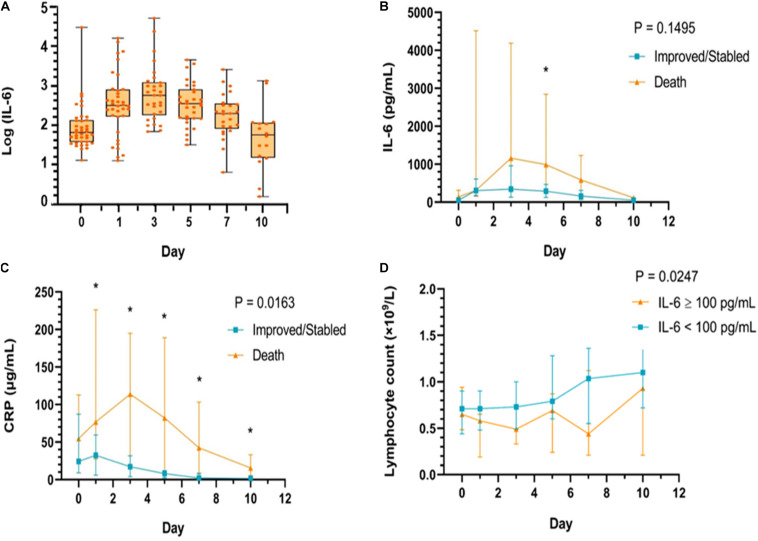
FIGURE 2.
The changing trend of IL-6 levels before and after tocilizumab treatment (A). The change of IL-6 (B) and hs-CRP (C) levels, respectively, during the tocilizumab treatment categorized by outcomes (improvement and death) at baseline, day 1, day 3, day 5, day 7, and day 10; (D) The change of lymphocytes (LYM) during the tocilizumab treatment categorized by baseline IL-6 level (using median value 100 pg/ml as cut-off value) at baseline, day 1, day 3, day 5, day 7, and day 10. *P < 0.05 compared with the improvement and death group.

