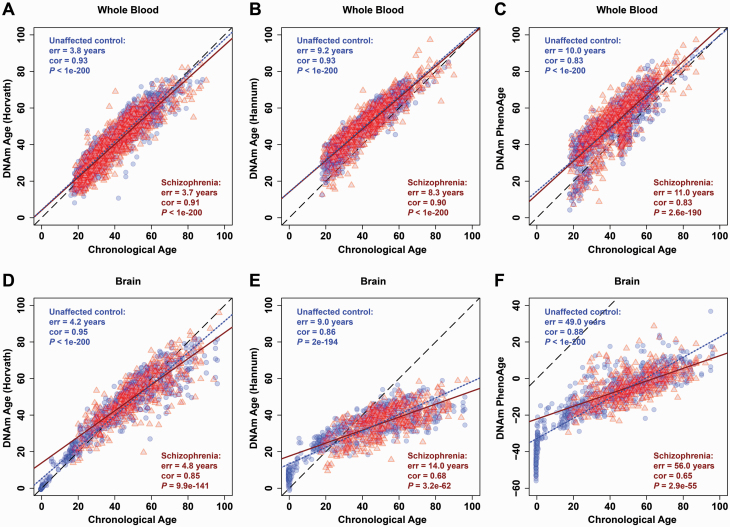
Fig. 1.
Correlation between epigenetic age and chronological age. The figure shows scatter plots of epigenetic age (y-axis) against chronological age (x-axis) in whole blood (A–C) and brain tissue (D–F) measured by the 3 “epigenetic clocks” described by Horvath6 (A, D), Hannum et al8 (B, E), and Levine et al9 (C, F). The black dashed line is the diagonal where epigenetic age equals chronological age. The regression of epigenetic age on chronological age was shown with blue dotted line for unaffected controls or with red solid line for schizophrenia patients. The prediction error (err), coefficient (cor), and P value of Pearson correlation analysis of epigenetic age with chronological age from unaffected controls (blue circles) or schizophrenia (red triangles) are shown within each panel.

