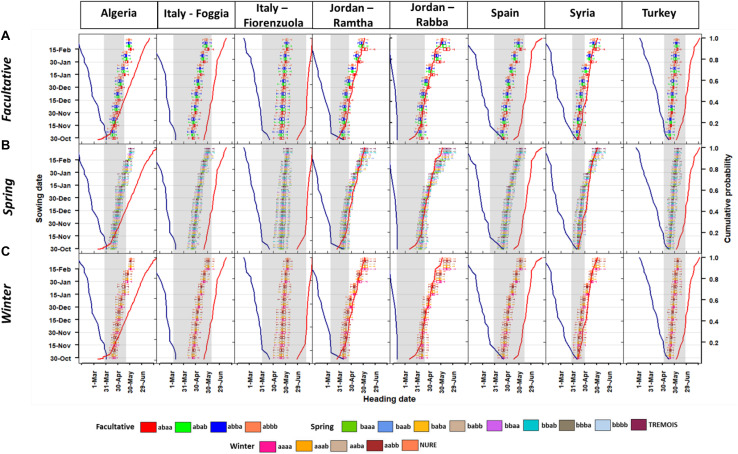
FIGURE 2.
Boxplots of the heading date at different sowing times for the (A) facultative, (B) spring, and (C) winter barley types. The secondary axis shows the probability for the last frost days (blue line on the left) and first heat days (red solid line on the right), these are calculated as the percentile of last frost days (<0°C) and first heat days (>35°C) from 1980 to 2010 and defined as 10% of risk for the last day of frost and 40% for first day of heat as defined in previous work (Zheng et al., 2013). For each boxplot, the end of the horizontal line represents, from the left to the right, the 10th percentile and the 90th percentile. The vertical line of the box, from the left to the right represents the 25th and 75th percentile, respectively.

