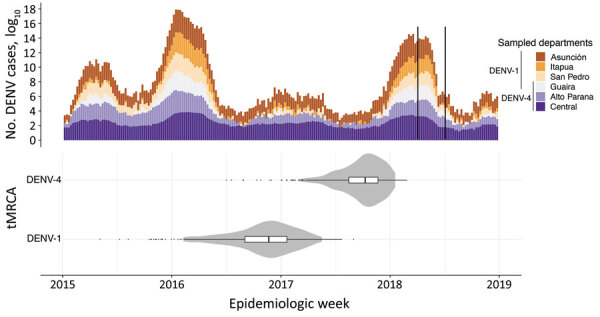
Figure 4.

Dengue virus (DENV) outbreaks in Paraguay during 2015–2018 and tMCRA of serotypes 1 and 4. A) Total cases of DENV infections reported by epidemiologic week in the departments from which genome sequences were available. The black bars in 2018 delimit the sampling time range for the DENV genomes. B) tMRCA for DENV-1 and DENV-4 in the same timescale as the number of cases reported. Violin plots show 95% CIs; internal boxplots show medians and interquartile ranges. tMCRA, time to most recent common ancestor.
