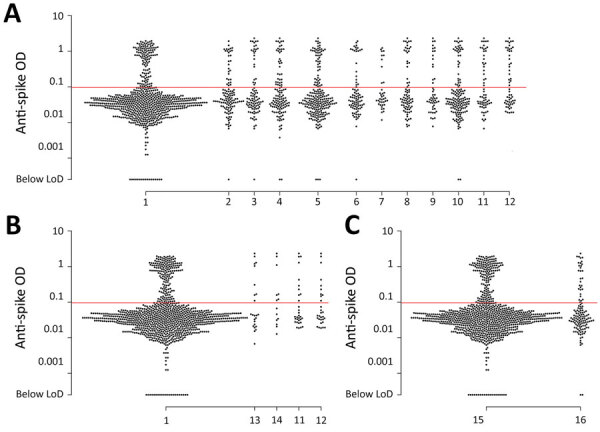
Figure 4.

Scatter plot of anti-spike IgG reactivity and association with recalled coronavirus disease (COVID-19) symptoms in a cross-sectional study of farmworkers, Monterey County, California, USA, July 16–November 30, 2020. A) Reactivity among persons who reported experiencing or not experiencing various symptoms potentially associated with COVID-19 since December 2019: 1, none of the symptoms listed here; 2, blocked nose (p = 0.027); 3, sweating (p = 0.010); 4, chills (p = 0.013); 5, headache (p = 0.034); 6, tickling in throat (p = 0.029); 7, sinus pain or pressure (p = 0.034); 8, loss of appetite (p<0.001); 9, shortness of breath (p = 0.006); 10, fatigue (p = 0.032); 11, loss of taste (p<0.001); 12, loss of smell (p<0.001). B) Reactivity among persons who reported experiencing or not experiencing various symptoms in the 2 weeks before enrollment (data not shown for symptoms with p>0.1): 1, none of the symptoms listed here; 13, chest pain (p = 0.061); 14, wheezing (p = 0.043); 11, loss of taste (p = 0.037); 12, loss of smell (p = 0.072). C) Reactivity among persons who had a positive or negative severe acute respiratory syndrome coronavirus 2 transcription-mediated amplification (TMA) nucleic acid assay result at the enrollment visit: 15, TMA-positive (p = 0.325); 16 TMA-negative. Reported p values are measured in logistic regression models with the occurrence of each symptom as the outcome and antibody ELISA OD values (log-transformed) as predictors and adjusted for age group and sex. Red lines indicate assay LoD. LoD, limit of detection; OD, optical density.
