
Figure 4. Interactions within the final post fusion conformation of gp41FP-TM modeled by MD.
(A) Model of gp41FP-TM (Figure 1—figure supplement 7C) after 1µs MD simulation in a bilayer. Phosphate groups of the phospholipids are shown as orange spheres to delineate the membrane boundaries. (B) Close-up on the MPER and FPPR flexible regions. (C) Close-up of the interaction of FP (residues 514–524) and TM (residues 681–692) viewed along the three-fold axis from the N-terminus indicating an intricate network of hydrophobic interactions (left panel) and from the side (right panel). Interacting side chains are labeled and shown as sticks.

Figure 4—figure supplement 1. Modeling a post fusion conformation by MD simulation.

(A) Ribbon of the crystal structure of gp41FP-TM. Numbering of chain B is as shown in Figure 1F. (B) Ribbon of the symmetric trimer model built from chains N-B and C-B of the gp41FP-TM structure. Residues 512–517 and 701–707 have been modeled in a helical conformation to provide complete models of FP and TM. (C) 1 µs MD simulation of the model shown in B, which refolds FPPR-FP and MPER-TM. The kinks in the TM at conserved Gly positions have been observed before (Pinto et al., 2019).
Figure 4—figure supplement 2. Positions of the conserved tryptophan residues of MPER in the post fusion model.
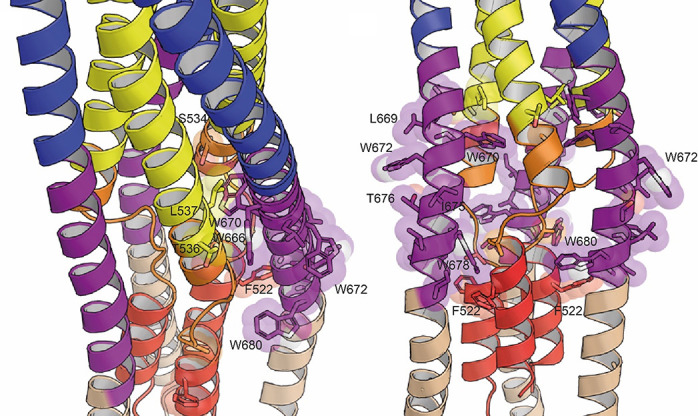
Tryptophan residues W666, W670, W672, W678, and W680 and their close-by potential contacts are shown as spheres.