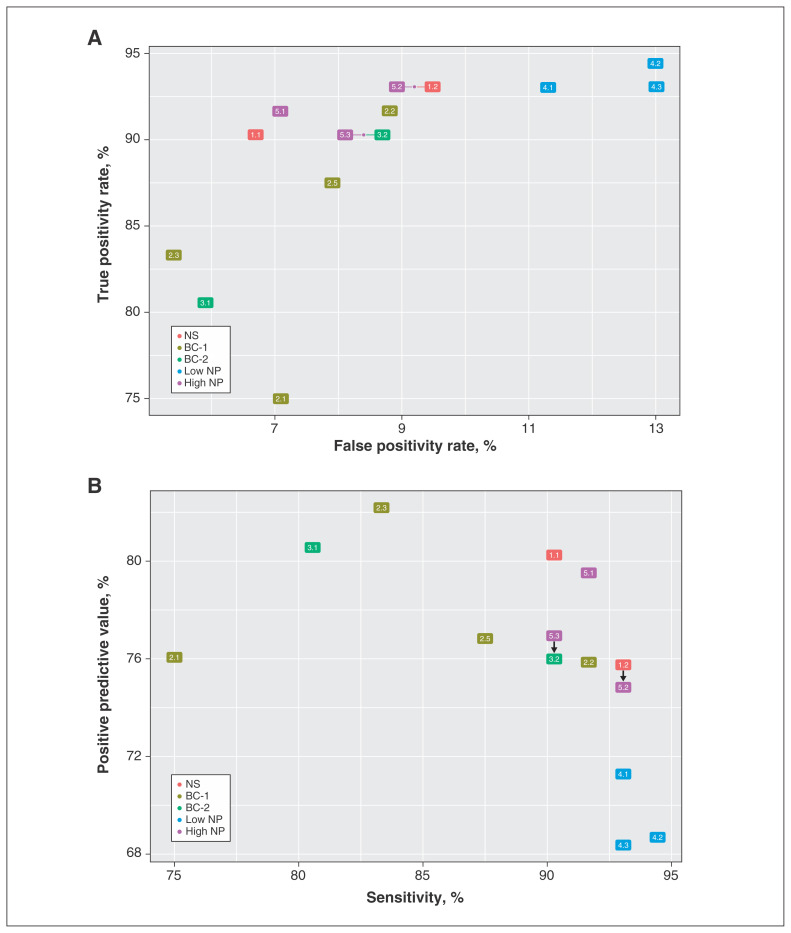
Figure 2:
True positivity rate versus false positivity rate (A) and sensitivity versus positive predictive value (B) for case definitions of heart failure in a population of patients with chronic obstructive pulmonary disease. The figure depicts all case definitions except definition 2.4. The arrows indicate that the 2 definitions have the same values on both axes. Note: BC-1 = definitions with expanding codes and testing iterations and specific combinations, BC-2 = definitions with the addition of furosemide, high NP = definitions including high-threshold natriuretic peptide, low NP = definitions including low-threshold natriuretic peptide, NS = original Nova Scotia Maritime Family Practice Research Network definitions. See Table 1 for details on the definitions.

