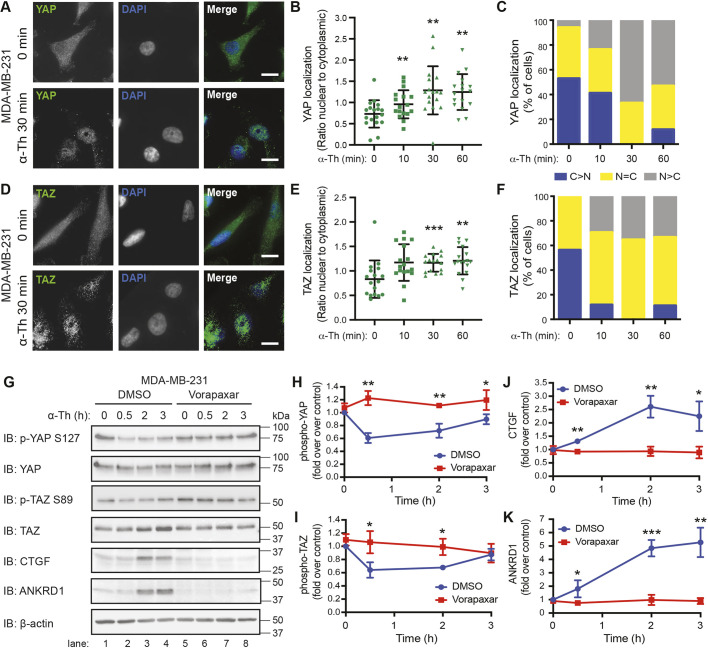
Fig. 1.
Thrombin activates the Hippo pathway in metastatic breast cancer cells through PAR1. (A–F) Subcellular localization of YAP (A–C) and TAZ (D–F) in MDA-MB-231 cells. Representative images of YAP (A) and TAZ (D) (green), and DAPI (blue) basally and after incubation with 10 nM α-thrombin (α-Th). Scale bars: 10 μm. (B,E) Ratio of nuclear-to-cytoplasmic localization of YAP (B) or TAZ (E) at the indicated times. Data are mean±s.d. Statistical significance was determined by one-way ANOVA (with Tukey′s post hoc test) of each time point compared with 0 min (n=18, six fields of view from three biological replicates). (C,F) Percentage of cells displaying greater cytoplasmic (blue; C>N), nuclear (gray; N>C) or equal (yellow; N=C) staining of YAP (C) or TAZ (F) at the indicated time points. (G–K) MDA-MB-231 cells were pretreated with DMSO or Vorapaxar (10 µM) then treated with 10 nM α-thrombin for the indicated times. Representative immunoblotting (IB) using the indicated antibodies is shown (G). β-actin expression was used as a control. Results are represented as the fold-change in YAP phosphorylation (H), TAZ phosphorylation (I), CTGF expression (J) and ANKRD1 expression (K) relative to 0 min DMSO control. Data are mean±s.d., n=3. Statistical significance was determined using an unpaired t-test, comparing DMSO to Vorapaxar treatment at each time point. *P<0.05; **P<0.01; ***P<0.001.

