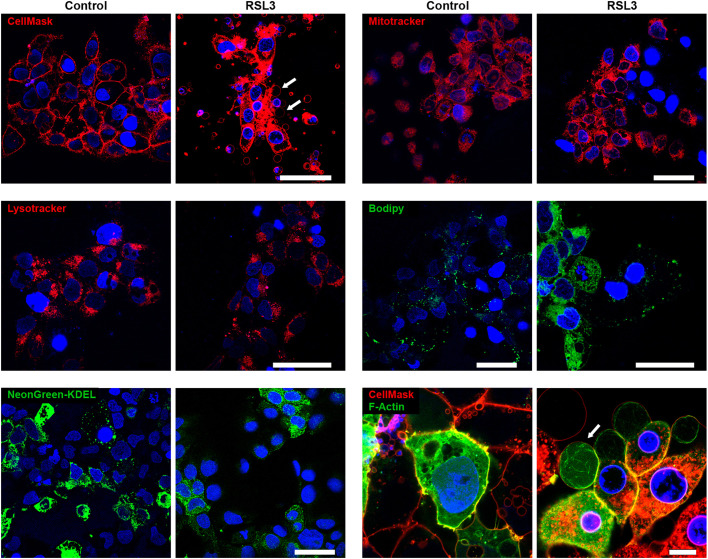
Fig. 3.
Analysis of subcellular components in BeWo macro-bleb cargo. Panels show live-cell images of BeWo cells processed for imaging with CellMask (cell membrane, red), MitoTracker (mitochondria, red), LysoTracker (lysosomes, red), Bodipy 493/503 (lipids, green), mNeonGreen tagged with the endoplasmic reticulum retention signal KDEL (green) or F-actin (actin, green). The cells were exposed to vehicle control or RSL3 (200 nM, 8 h) after the cells were stained with each probe as detailed in Materials and Methods. Nuclei were stained with DAPI. White arrows in some of the panels point to macro-blebs. The images shown are representative of three independent experiments. Scale bars: 50 μm.

