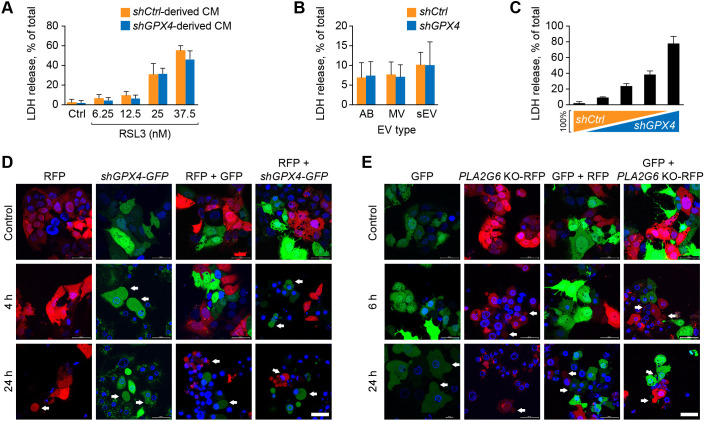
Fig. 4.
Ferroptotic cells do not transfer a ferroptotic signal to neighboring WT cells. (A) The effect of conditioned medium (CM), derived from WT or shGPX4 BeWo cells, on ferroptosis in recipient WT BeWo cells. The CM was harvested followed by centrifugation of CM at 500 g for 10 min to remove cell debris. The recipient cells were exposed to CM for 8 h and then washed and cultured in serum-free medium with a range of concentrations of RSL3 for 24 h. Ferroptosis was measured by the LDH release assay as described in Materials and Methods. Values are shown as means±s.d. Data were analyzed by unpaired two-tailed t-test (no significant differences were found between control shRNA and shGPX4). (B) The effect of isolated extracellular vesicles (EVs) from shGPX4 BeWo cells versus WT BeWo cells, both exposed to RSL3 (25 nM, 24 h). Ferroptosis was determined after 24 h of incubation with EVs, using the LDH release assay, as described in the Materials and Methods. AB, apoptotic bodies; MV, microvesicles; sEV, small extracellular vesicles. The EVs were isolated as detailed in Materials and Methods. Values are shown as means±s.d. Data were analyzed using unpaired two-tailed t-test (no significant differences were found between control shRNA and shGPX4). (C) Co-cultures of WT and shGPX4 BeWo cells, exposed to RSL3, 25 nM for 24 h. The percentage of WT and shGPX4 types was 100/0, 75/25, 50/50, 25/75, and 0/100, respectively. Ferroptosis was determined by the LDH release assay, as described in Materials and Methods. (D,E) The effect of co-culturing ferroptotic shGPX4 BeWo with WT BeWo cells (D) or ferroptotic PLA2G6 KO with WT BeWo cells (E) on bleb formation in WT BeWo cells. The cells were cultured on glass bottom dishes. In D, ferroptotic cells were transfected with GFP and WT cells with RFP. In panel E, ferroptotic cells were transfected with RFP and WT cells with GFP, as described in the Materials and Methods. All cells were co-stained with DAPI. The upper panels show cultures without added RSL3 and the lower panels show cultures with added 25 nM RSL3 for 4 h or 24 h. Note that, at 24 h with RSL3, even some of the control cells started exhibiting blebbing, as shown in both D and E. White arrows indicate representative blebs. Scale bars: 50 μm. All panels and images are representative of three independent experiments.

