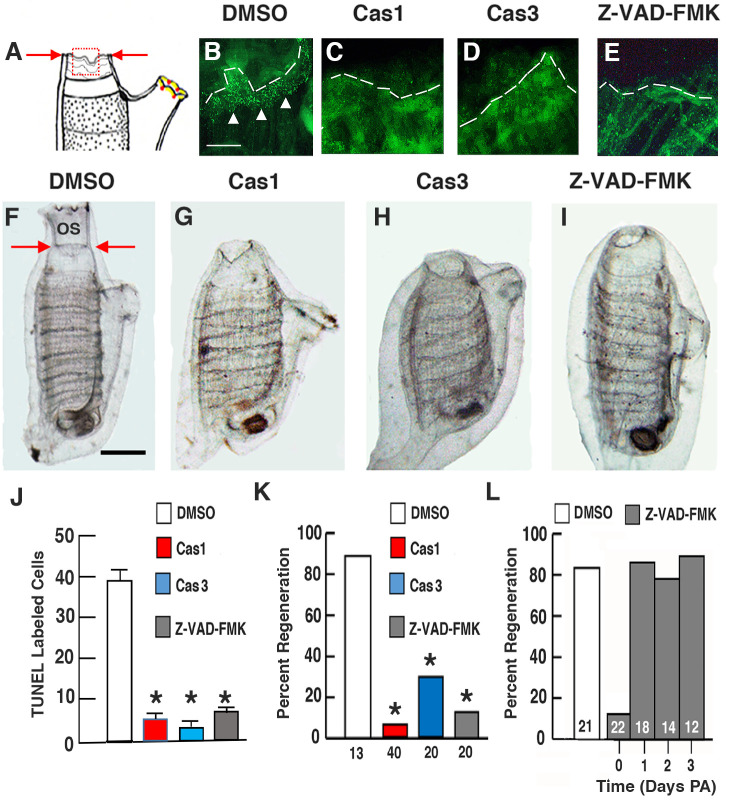
Fig. 1.
Apoptosis is required for distal body regeneration. (A) An illustration of a regenerating animal at 1-day post-amputation showing the region of the siphon margin (red square) in which TUNEL labeling was determined in B–E. Arrows show the position of amputation. (B–E) Animals with amputated oral siphons assayed by TUNEL labeling (arrowheads) at the amputation margin (dashed lines) after treatment with (B) DMSO (control), (C) caspase 1 inhibitor, (D) caspase 3 inhibitor, or (E) pan-caspase inhibitor Z-VAD-FMK at 12 h PA. Scale bar: 20 µm; magnification is the same in B–E. (F–I) Oral siphon regeneration assayed at 6 days PA after continuous treatment since amputation with (F) DMSO (control), (G) caspase 1 inhibitor, (H) caspase 3 inhibitor, or (I) pan-caspase inhibitor Z-VAD-FMK. Arrows in F show position of amputation. OS, oral siphon. Scale bar: 100 µm; magnification is the same in F–I. (J) Bar graphs comparing TUNEL labeling along the anterior margins of amputated siphon stumps in DMSO, caspase 1 inhibitor, caspase 3 inhibitor, and pan-caspase inhibitor Z-VAD-FMK treated animals with amputated oral siphons at 12 h PA. N=6 for each bar. Error bars: s.e.m. Asterisks indicate significant differences at P<0.001 between the control and caspase inhibitor treated animals. Statistics by one-way ANOVA and post-hoc Tukey with Bonferroni correction. (K) Bar graphs showing the percentage of regeneration at 6 days PA after continuous treatment with DMSO (control), caspase 1 inhibitor, caspase 3 inhibitor, or pan-caspase inhibitor Z-VAD-FMK since the time of amputation. Numbers of animals are indicated at the bases of the bars. Asterisks indicate significant differences at P<0.001 between the control and caspase inhibitor treated animals. Statistics by χ2 test and post-hoc Fisher's exact test with Bonferroni correction. (L) Bar graphs showing the relationship between the beginning of pan-caspase inhibitor Z-VAD-FMK treatment after oral siphon amputation and the percentage of regeneration at 6 days PA. Numbers of animals are indicated within the bars. Asterisk indicates significant difference at P<0.001 between the control and day 0 caspase inhibitor treated animals. Statistics by χ2 test and post-hoc Fisher's exact test with Bonferroni correction. Each experiment was replicated at least three times.

