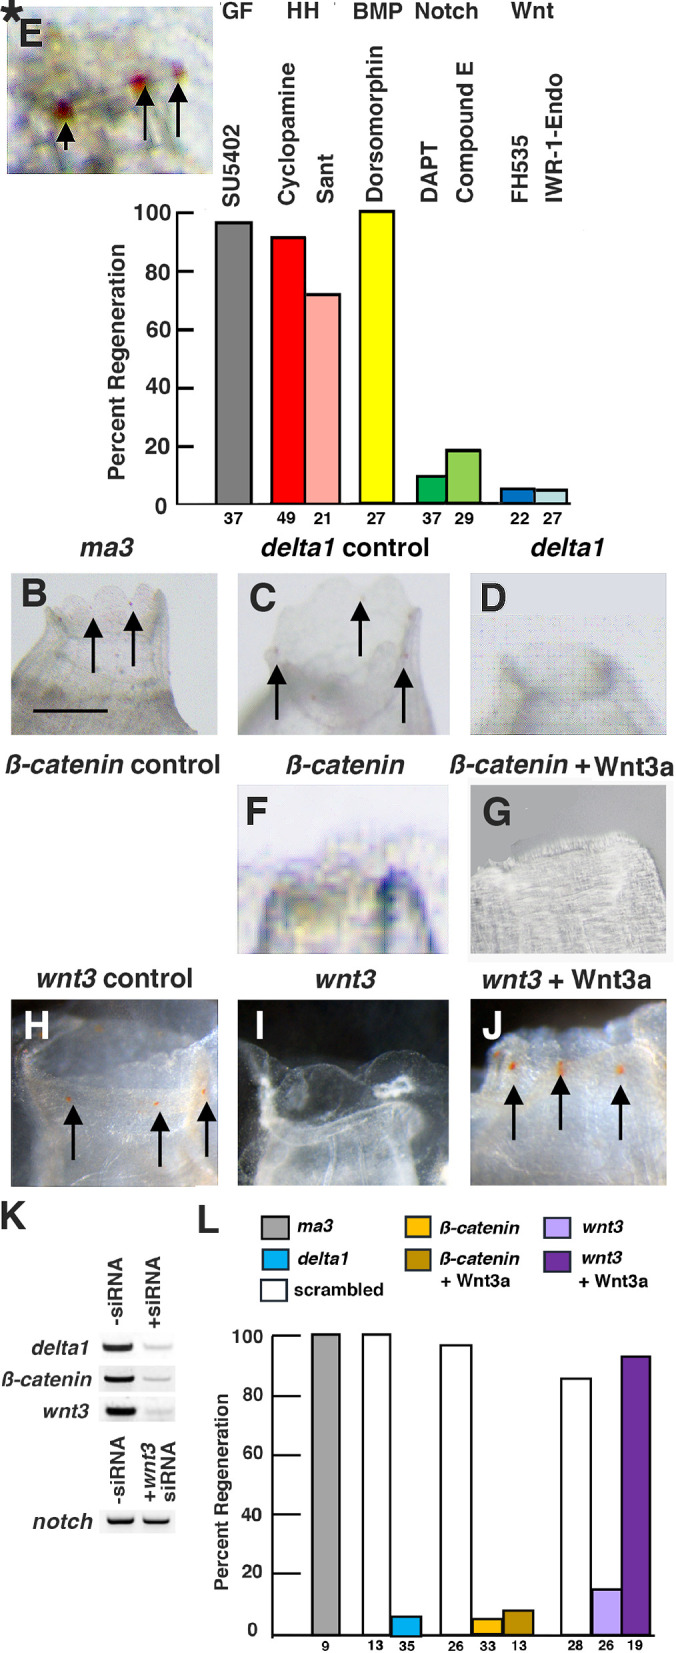
Fig. 3.

Pharmacological screen and siRNA effects on oral siphon regeneration. (A) Bar graphs showing the effects of signaling system inhibitors on percent oral siphon regeneration. Percent oral siphon regeneration was determined with respect to controls treated with DMSO. The inhibitors and affected signaling systems are shown at the top of the bars. The numbers of animals assayed are shown at the bottom of the bars. Black asterisks indicate significant differences at P<0.001 between the control and inhibitor treated animals. Red asterisk indicates significant difference at P<0.01. Statistics by χ2 test and post-hoc Fisher's exact test with Bonferroni correction. (B–J) Effects of siRNA on oral siphon regeneration. (B,C,E,H) Normal regeneration after treatment with (B) ma3 siRNA, (C) scrambled delta1 siRNA, (E) scrambled ß-catenin siRNA, or (H) scrambled wnt3 siRNA. (D,F,G,I) Suppression of regeneration after treatment with (D) delta1 siRNA, (F) ß-catenin siRNA, (G) ß-catenin siRNA and Wnt3a, or (I) wnt3 siRNA. (J) Rescue of regeneration after treatment with wnt3 siRNA and Wnt3a. Arrows: oral siphon pigmented organs. (K) RT-PCR showing delta1, ß-catenin, and wtn3 mRNA expression at 6 days post-amputation without corresponding siRNA (-siRNA) and with corresponding siRNA (+siRNA) and notch expression without wnt3 siRNA (−siRNA) and with wnt3 siRNA (+wnt3 siRNA). (L) Bar graphs showing the effects of siRNA on percent oral siphon regeneration and rescue by exogenous Wnt3a. The number of animals used in each experiment is shown at the bottom of the bars. Black asterisks indicate significant differences at P<0.001 between the respective scrambled controls and the corresponding siRNA treated animals. Red asterisk indicates significant difference at P<0.01. Statistics by χ2 test and post-hoc Fisher's exact test with Bonferroni correction. Each experiment was replicated at least two times.
