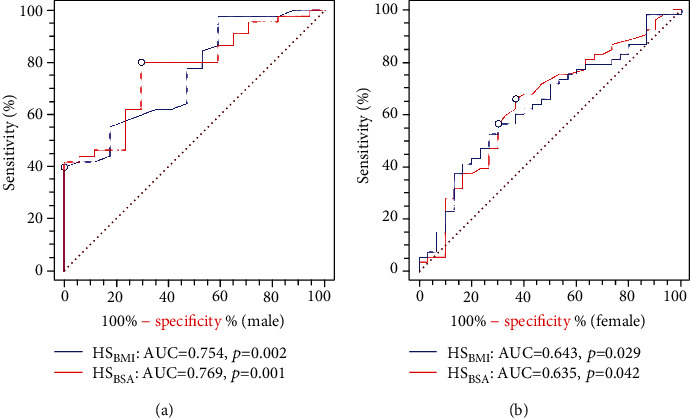
Figure 3.

ROC analysis of the associations among HSBMI and HSBSA with VO2max in male and female young adults. (a) The ROC curve between VO2max and HSBMI and HSBSA in male participants. (b) The ROC curve between VO2max and HSBMI and HSBSA in female participants. BMI: body mass index; BSA: body surface area; HSBMI: HSaverage adjusted for BMI; HSBSA: HSaverage adjusted for BSA; VO2max: maximum oxygen uptake; AUC: area under curve.
