
Figure 8.
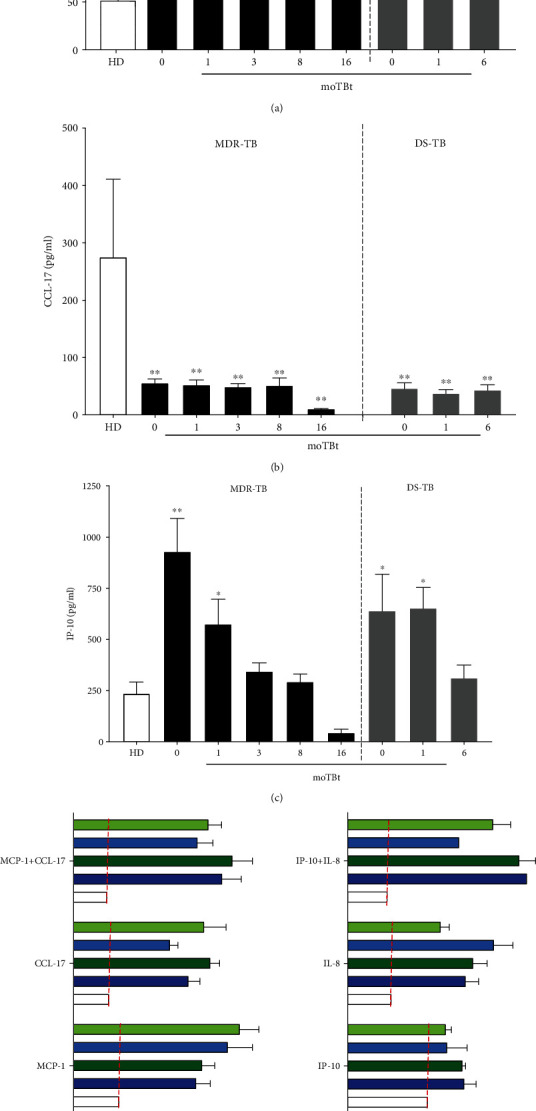
Plasma chemokine levels and migration capacity of leukocytes during MDR-TB and DS-TB. Plasma levels of (a) MCP-1, (b) CCL-17, and (c) IP-10 were determined by ELISA in multidrug-resistant (MDR-TB) and drug-sensitive (DS-TB) patients. (HD: n = 6, MDR-TB: basal, 1, and 3 moTBt n = 14, 8 moTBt n = 11, and 16 moTBt n = 10. DS-TB: basal and 1 moTBt and 6 moTBt n = 11). Peripheral blood mononuclear cells (PBMCs) from DS-TB and MDR-TB patients isolated before and after anti-TB treatment, evaluated for their ability to migrate in response to (d) MCP-1 and CCL17 or (e) IP-10 and IL-8, using a fluorometric assay (HD: n = 3, MDR-TB: n = 4 (before treatment) and n = 3 (after treatment), DS-TB: n = 3). The relative fluorescence unit (RFU) is indicative of the magnitude of cellular migration. Bar graphs show means ± standard error of the mean (SEM). Differences between patient groups and HD at each time point or experimental condition were analyzed using multiple Student's t-test corrected for multiple comparisons using the Sidak–Bonferroni method. ∗p < 0.05, ∗∗p < 0.01, ∗∗∗p < 0.001, and ∗∗∗∗p < 0.0001. moTBt: months of antituberculosis treatment.