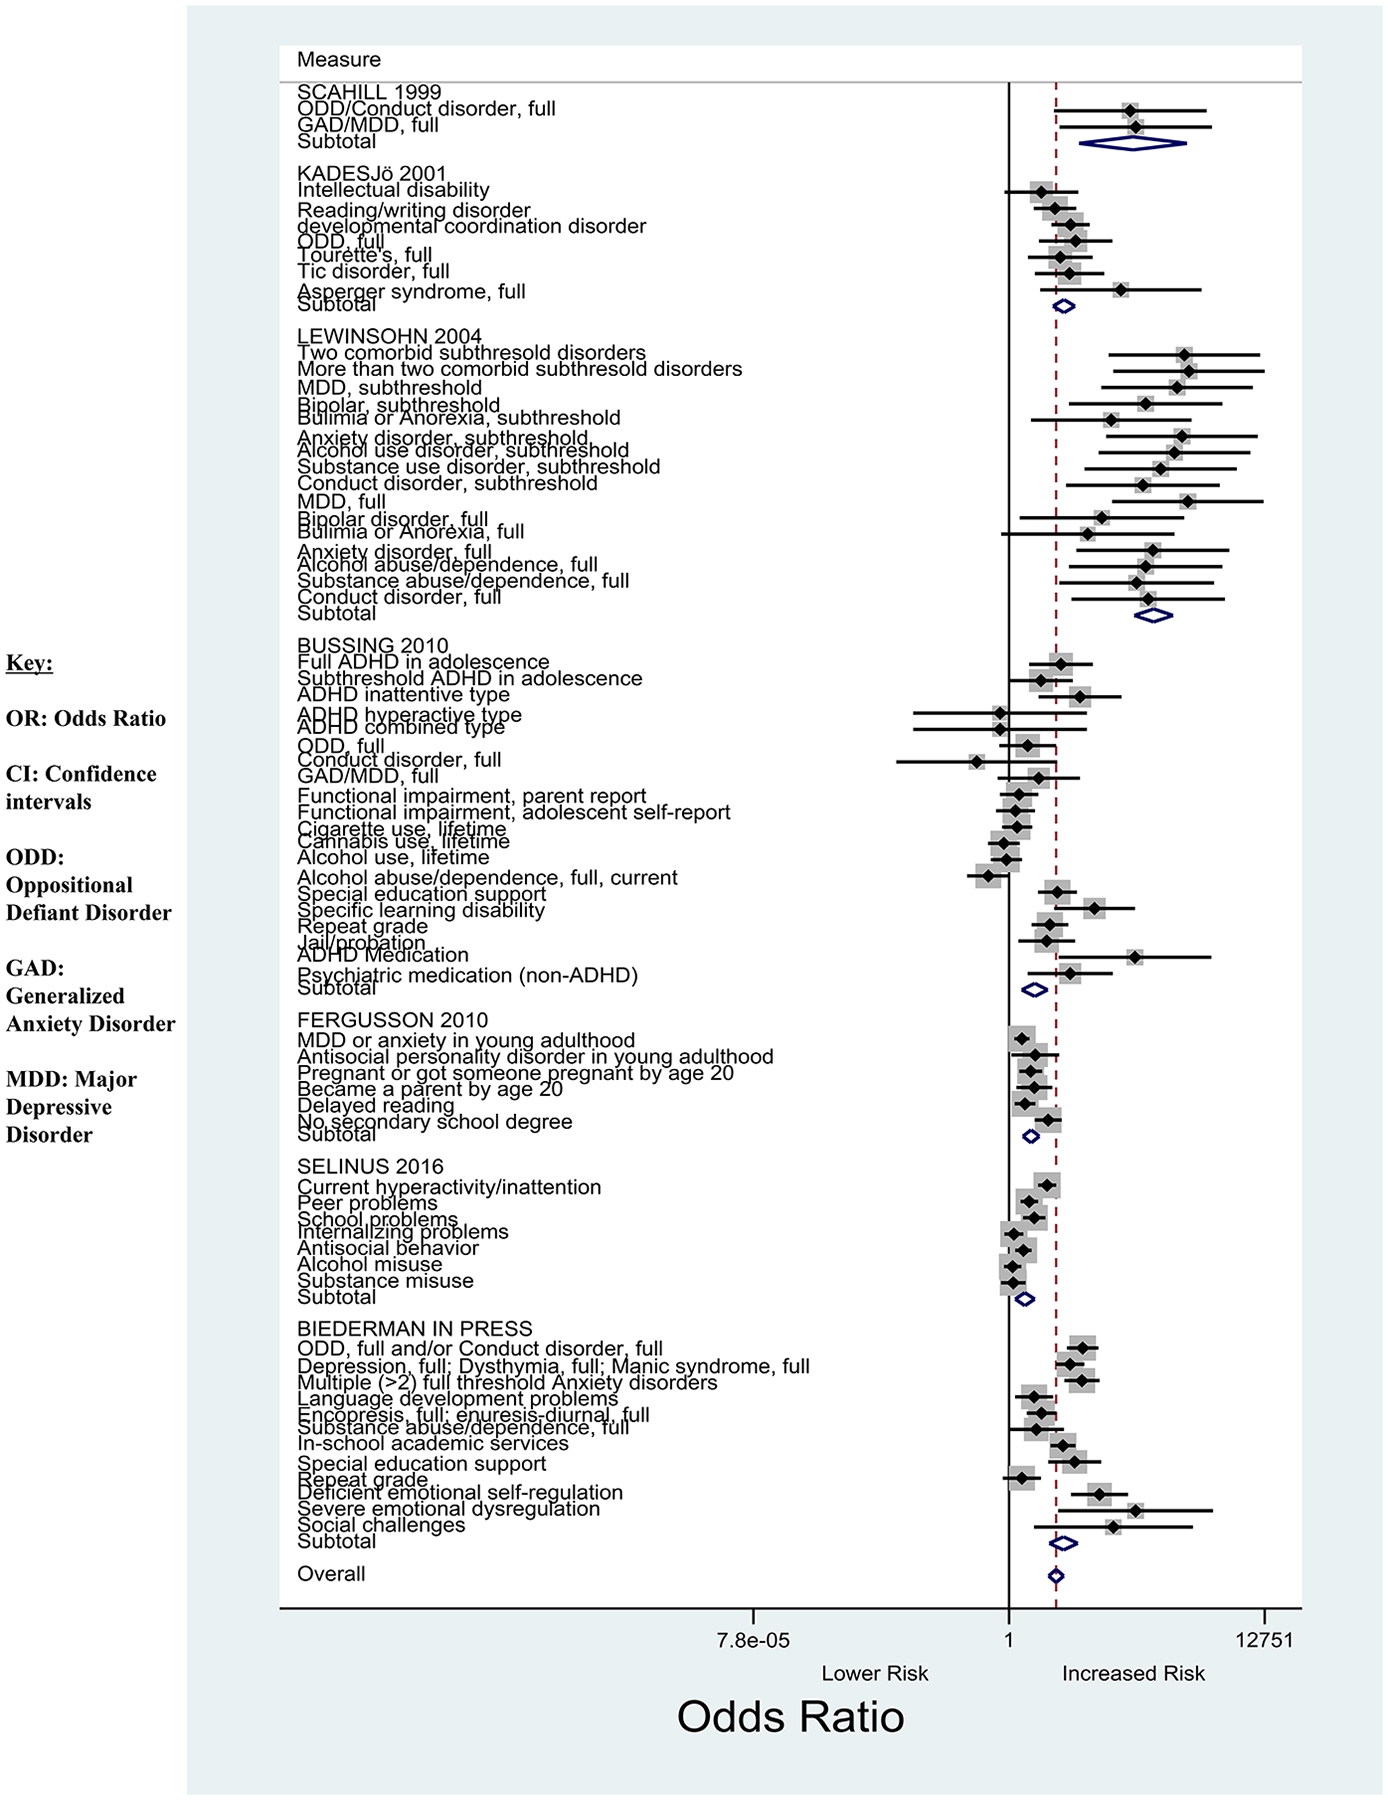
Figure 4.

Forest plot showing the OR and 95% CI for binary outcome variables between the subthreshold ADHD group and controls.
*The area of each square is proportional to the sample size for that particular variable included in the meta-analysis.

Forest plot showing the OR and 95% CI for binary outcome variables between the subthreshold ADHD group and controls.
*The area of each square is proportional to the sample size for that particular variable included in the meta-analysis.