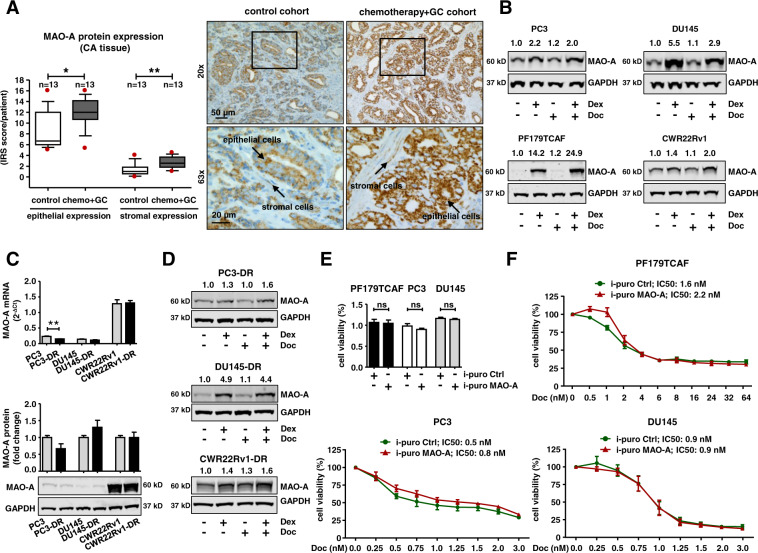
Fig. 4. Screening of MAO-A expression after chemotherapeutic treatment.
A Quantification of epithelial and stromal MAO-A IRS within cancerous areas of 13 selected chemotherapy and control patients (Mann–Whitney test; *, P < 0.05; **, P < 0.01; Box Whisker Plot with 10–90 percentile) and representative microscopy images. Magnification: 20× (scale bar = 50 µm) and 63× (scale bar = 20 µm). B Representative western blots for MAO-A protein expression after single treatment with either 100 nM Dex or 3 nM docetaxel, or combination of both drugs for 72 h within different cell models. C Basal MAO-A mRNA and protein expression in different parental and docetaxel resistant cell models. mRNA data represent mean + SE from three independent experiments (unpaired t-test; **, P < 0.01). D Representative western blots for MAO-A protein expression, after single treatment with either 100 nM Dex or 12.5 nM docetaxel, or combination of both drugs for 72 h within different docetaxel resistant cell models. E Basal cell viability after 5 days for PF179TCAF, PC3, and DU145 cells containing a constitutive MAO-A overexpression or control vector. F Cell viability screen after 5 days for PF179TCAF, PC3, and DU145 cells containing a constitutive MAO-A overexpression or control vector in the presence of increasing concentrations of docetaxel.

