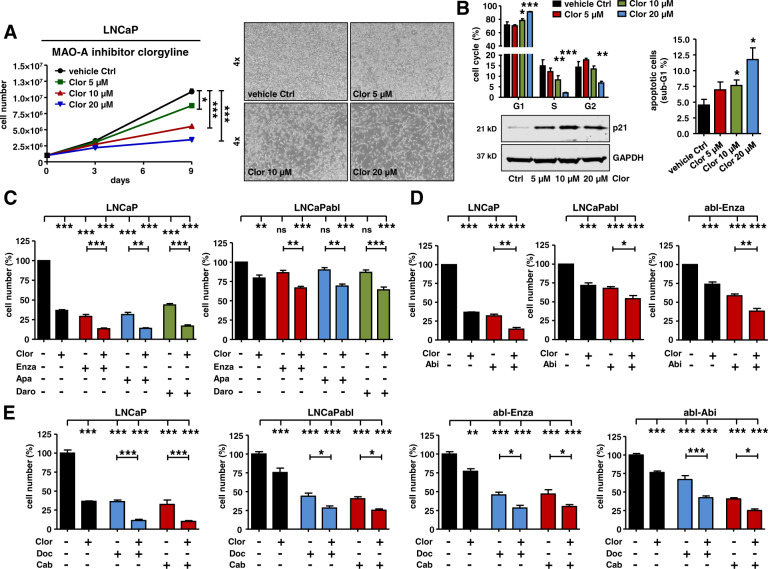
Fig. 6. Consequences of MAO-A inhibition for PCa cell growth and viability.
A Measurement of LNCaP cell growth and representing cell pictures after 9 d treatment with increasing concentrations (5 µM, 10 µM, 20 µM) of the specific MAO-A inhibitor clorgyline. Data represent mean + SE from four independent experiments (one-way ANOVA and correction for multiple testing using Dunnett´s comparison test; *, P < 0.05; ***, P < 0.001). B Measurement of cell cycle distribution and percentage of apoptotic cells, as well as western blot analysis for p21 protein expression after treatment with increasing clorgyline concentrations for 9 d. Data represent mean + SE from four independent experiments (one-way ANOVA and correction for multiple testing using Dunnett´s comparison test; *, P < 0.05; **, P < 0.01; ***, P < 0.001). C LNCaP and LNCaPabl cell growth measurement after 9 d treatment with 10 µM clorgyline alone or in combination with 2.5 µM enzalutamide, apalutamide, or darolutamide. Data represent mean + SE from at least three independent experiments (one-way ANOVA and correction for multiple testing using Bonferroni´s comparison test; **, P < 0.01; ***, P < 0.001). D LNCaP, LNCaPabl, and abl-Enza cell growth measurement after 9 d treatment with 10 µM clorgyline alone or in combination with 2.5 µM abiraterone. Data represent mean + SE from at least three independent experiments (one-way ANOVA and correction for multiple testing using Bonferroni´s comparison test; *, P < 0.05; **, P < 0.01; ***, P < 0.001). E LNCaP, LNCaPabl, abl-Enza, abl-Abi cell growth measurement after 9 d treatment with 10 µM clorgyline alone or in combination with 0.4 nM (for LNCaP, LNCaPabl, abl-Enza) or 0.75 nM (for abl-Abi) docetaxel or cabazitaxel. Data represent mean + SE from at least three independent experiments (one-way ANOVA and correction for multiple testing using Bonferroni´s comparison test; *, P < 0.05; **, P < 0.01; ***, P < 0.001).

