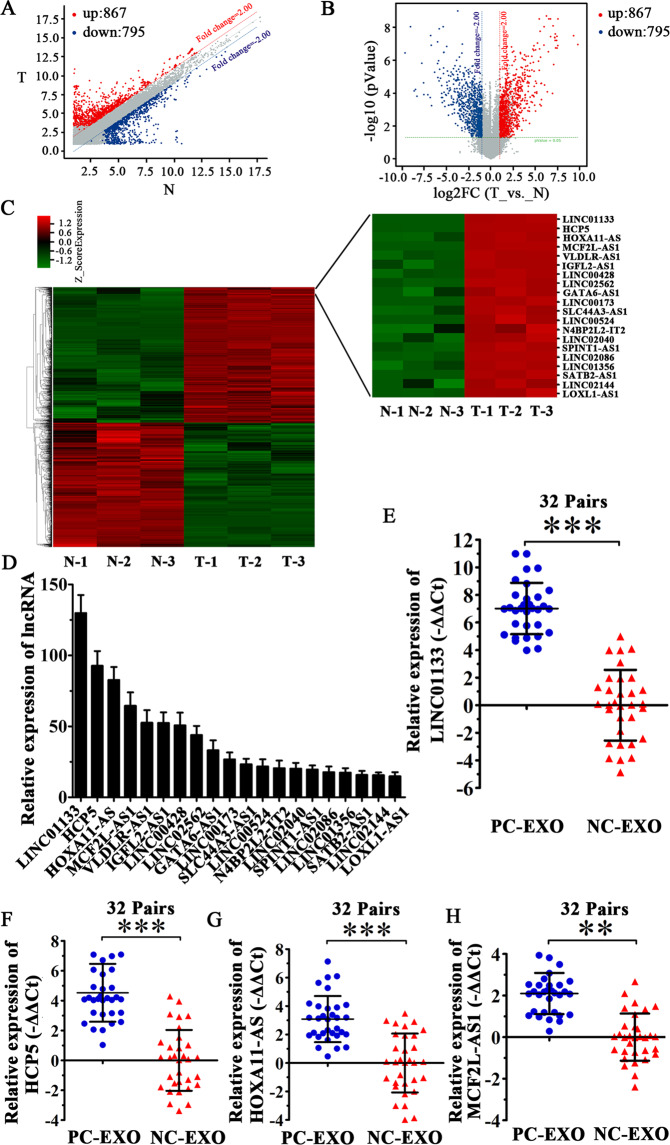
Fig. 1. Identification of lncRNA expression profiles in pancreatic cancer.
A Scatter plot of expression of various lncRNAs in the exosomes of pancreatic cancer cells and normal pancreatic ductal epithelial cells. The lncRNAs above the top red line and below the bottom blue line are those upregulated or downregulated more than twofold. T: pancreatic cancer cell exosomes; N: normal pancreatic ductal epithelial cell exosomes. B Volcano plot depicting the differential expression between these two groups. The red and blue dots represent lncRNAs with more or less than twofold changes in expression, respectively. C Hierarchical cluster analysis of the top 20 upregulated lncRNAs in pancreatic cancer cell exosomes matched with normal pancreatic ductal epithelial cell exosomes. D Histogram depicting the relative expression of the top 20 upregulated lncRNAs in pancreatic cancer cell exosomes compared with normal pancreatic ductal epithelial cell exosomes. E–H We detected the expression of top four upregulated lncRNAs in samples from 32 pairs pancreatic cancer tissues by qRT-PCR. All experiments were repeated three times, and the significance was analyzed using a Student’s t test. Data are shown as mean ± SD (**P < 0.01 and ***P < 0.001 vs. control).

