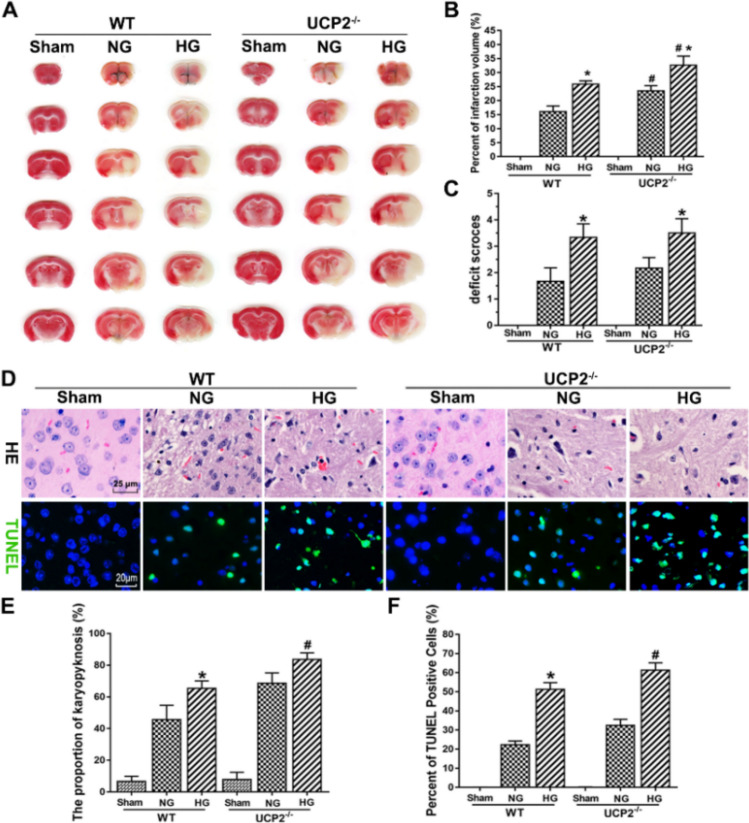
Fig. 1.
UCP2 deficiency exacerbated I/R-induced histopathological changes and apoptosis in hyperglycemic mice. a Representative images of TTC staining in each group. b Bar graph summarizing the percent infarction volume in WT and UCP2−/− mice. c Assessment of neurological deficits. d HE staining and TUNEL staining. e Quantitative summary of pyknotic cells. f Bar graph summarizing the percentage of TUNEL-positive cells. #p < 0.05 vs. the WT group; *p < 0.05 vs. the NG group (n = 6 in each group)

