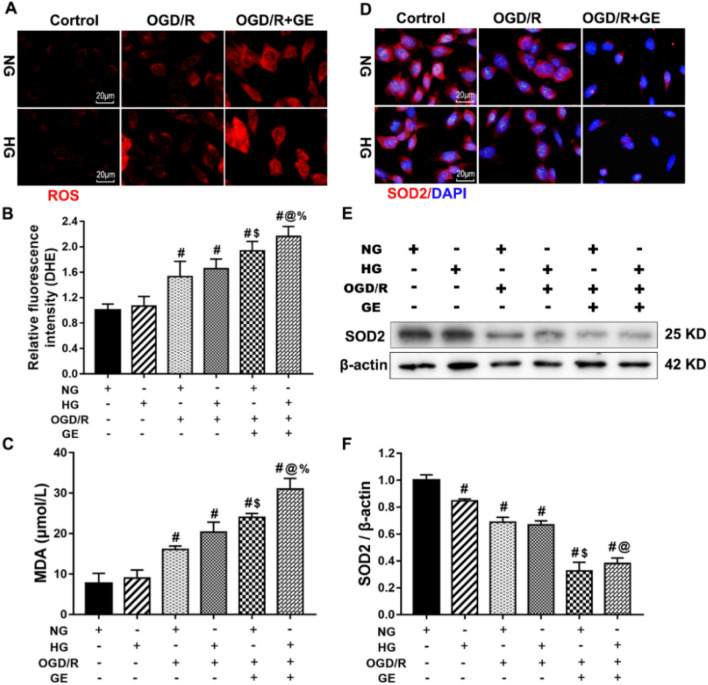
Fig. 6.
UCP2 deficiency enhanced the production of ROS in HT22 cells under OGD/R and high glucose conditions. a DHE fluorescence. ROS were detected by the DHE probe (Red). b The presence of ROS was determined using DHE. c The MDA level in the different groups of HT22 cells. d SOD2 fluorescence. SOD (green color) was detected using antibodies. DAPI (blue color) labeled the nuclei. e Representative western blots showing SOD2 expression. f Quantification of the average SOD2 expression normalized to β-actin. The experiments were repeated three times in triplicate for each condition. #p < 0.05 vs. Control; *p < 0.05 vs. HG; $p < 0.05 vs. NG + OGD/R; @p < 0.05 vs. HG + OGD/R; %p < 0.05 vs. NG + OGD/R + GE

