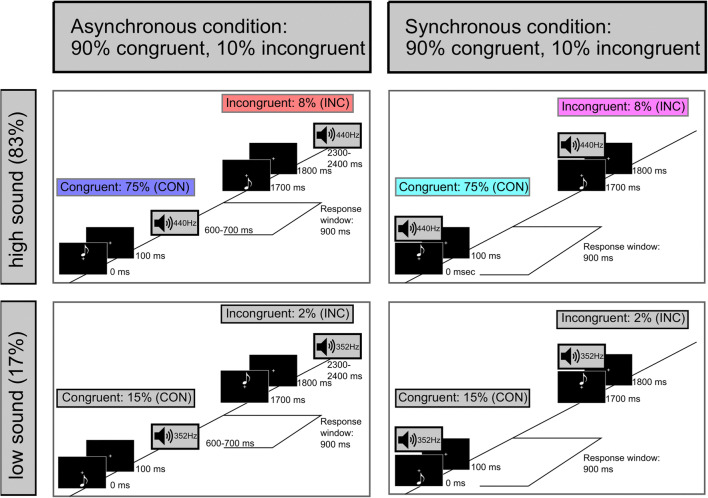
Fig. 1.
Schematic of the experimental design. Asynchronous (left) and synchronous (right) presentation conditions. In the asynchronous condition, the visual stimulus preceded the auditory stimulus by 600 ms. In the synchronous condition, visual and auditory stimuli were presented simultaneously. The response window started in both conditions with the presentation of the auditory stimulus and lasted 900 ms. The participants’ task was to indicate the pitch of the sound via button press. In both conditions, 90% of the trials were congruent (CON: visual and auditory stimulus either above fixation cross and high-pitched sound or below fixation cross and low-pitched sound) and 10% of the trials were incongruent (INC: visual and auditory stimulus either above fixation cross and low-pitched sound or below fixation cross and high-pitched sound). The probability of each visual-cue–sound combination is indicated. One of the tones (counterbalanced across participants) was presented more frequently (top row: standard tone, 83%) than the other tone (bottom row: deviant tone, 17%). This results in a more frequent presentation of the congruent visual-cue–sound combination with the frequent tone (asynchronous condition: blue; synchronous condition: cyan). The same color code is used for the presentation of the results. Only the frequent tone conditions (CON: blue/cyan and INC: red/magenta) are considered for analyses to investigate the elicitation of an IR. (Color figure online)

