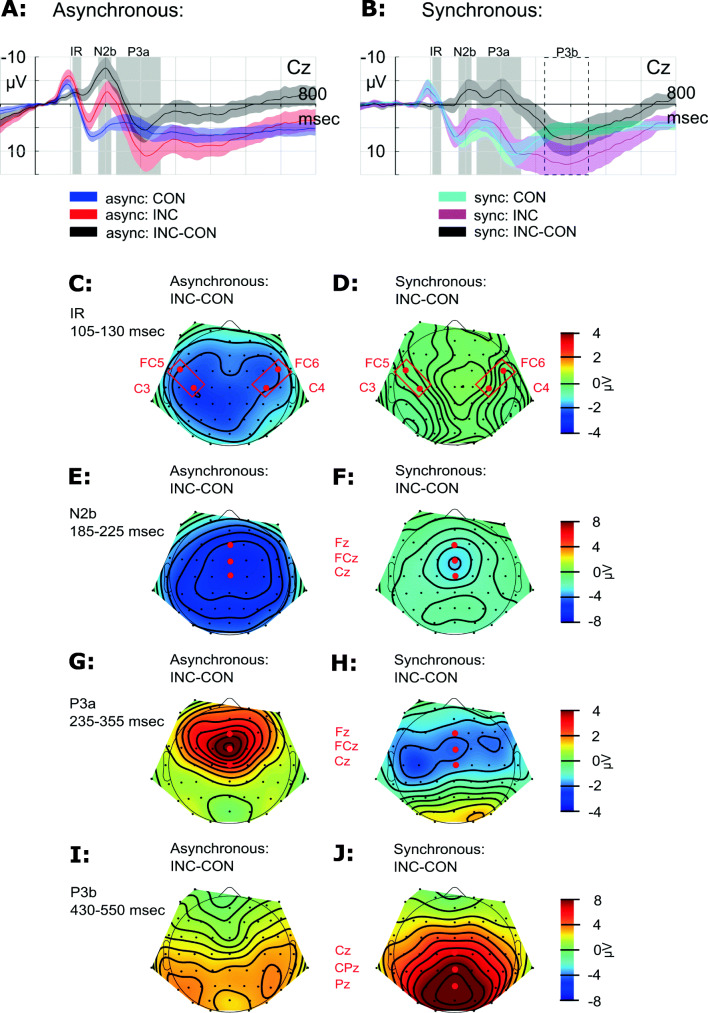
Fig. 3.
a–b Auditory ERPs and difference waveforms for asynchronous (left) and synchronous (right) conditions exemplary at the electrode Cz. Grand averages and corresponding 95% confidence intervals (CIs) are displayed. Statistical testing window for the investigation of the IR, N2b and P3a elicitation is indicated with a gray bar. The alternative statistical testing window for the P3b analysis is indicated with dotted lines. Row 2–5: Potential maps (nose referenced) show the scalp distribution within the IR (105–130 ms, c–d), N2b (185–225 ms, e–f), P3a (235–355 ms, g–h), and P3b (430–550 ms, i–j) time window of the difference data (incongruent-minus-congruent) for the asynchronous (left) and synchronous (right) conditions. ROIs for statistical analyzes are indicated in red. (Color figure online)

