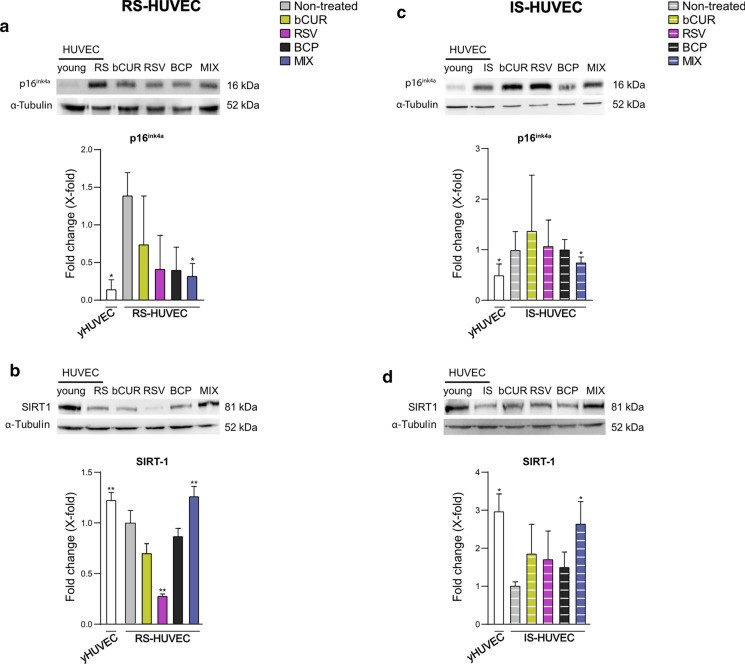
Fig. 5.
p16ink4a and SIRT1 protein level after treatment with bCUR, RSV and BCP and their combination in RS- and IS-HUVECs. a and c p16ink4a protein level and densitometric analysis; b and d SIRT1 protein level and densitometric analysis. Data are reported as fold change vs untreated senescent HUVECs. All data were normalized using α-tubulin as internal control. Bands were quantified by ImageJ; histograms represent the mean of the protein expression detected in three different experiments ± SD. Paired t test *p < 0.05 versus RS- and IS-HUVECs; **p < 0.01 versus RS- and IS-HUVECs. bCUR, bioCurcumin; RSV, resveratrol; BCP, β‐caryophyllene; RS, replicative senescence; IS, induced senescence. RS-HUVECs data are depicted in the left panel (solid-coloured histograms); IS-HUVECs data are reported in the right panel (striped histograms)

