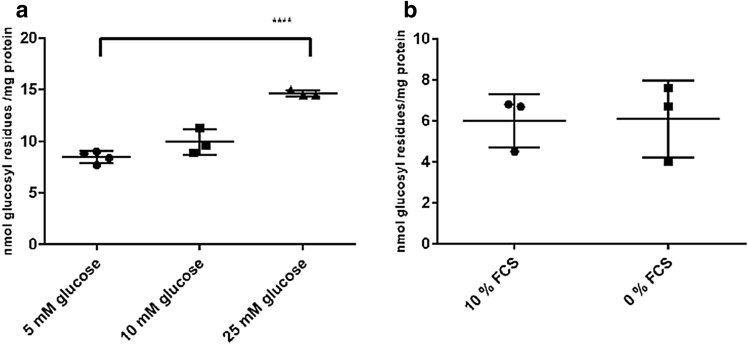
Fig. 2.
Influence of glucose concentration and FCS on the glycogen content of NSC-34 cultures. a Cells were cultured to confluency in DMEM/10% FCS/25 mM glucose, the medium was changed to media containing 5, 10 and 25 mM glucose, respectively, and cells cultured for another 60 min. b Cells were cultured to confluency, then switched to DMEM/25 mM glucose with or without FCS and cultured for another 60 min. Significant differences are as indicated: ****p < 0.0001

