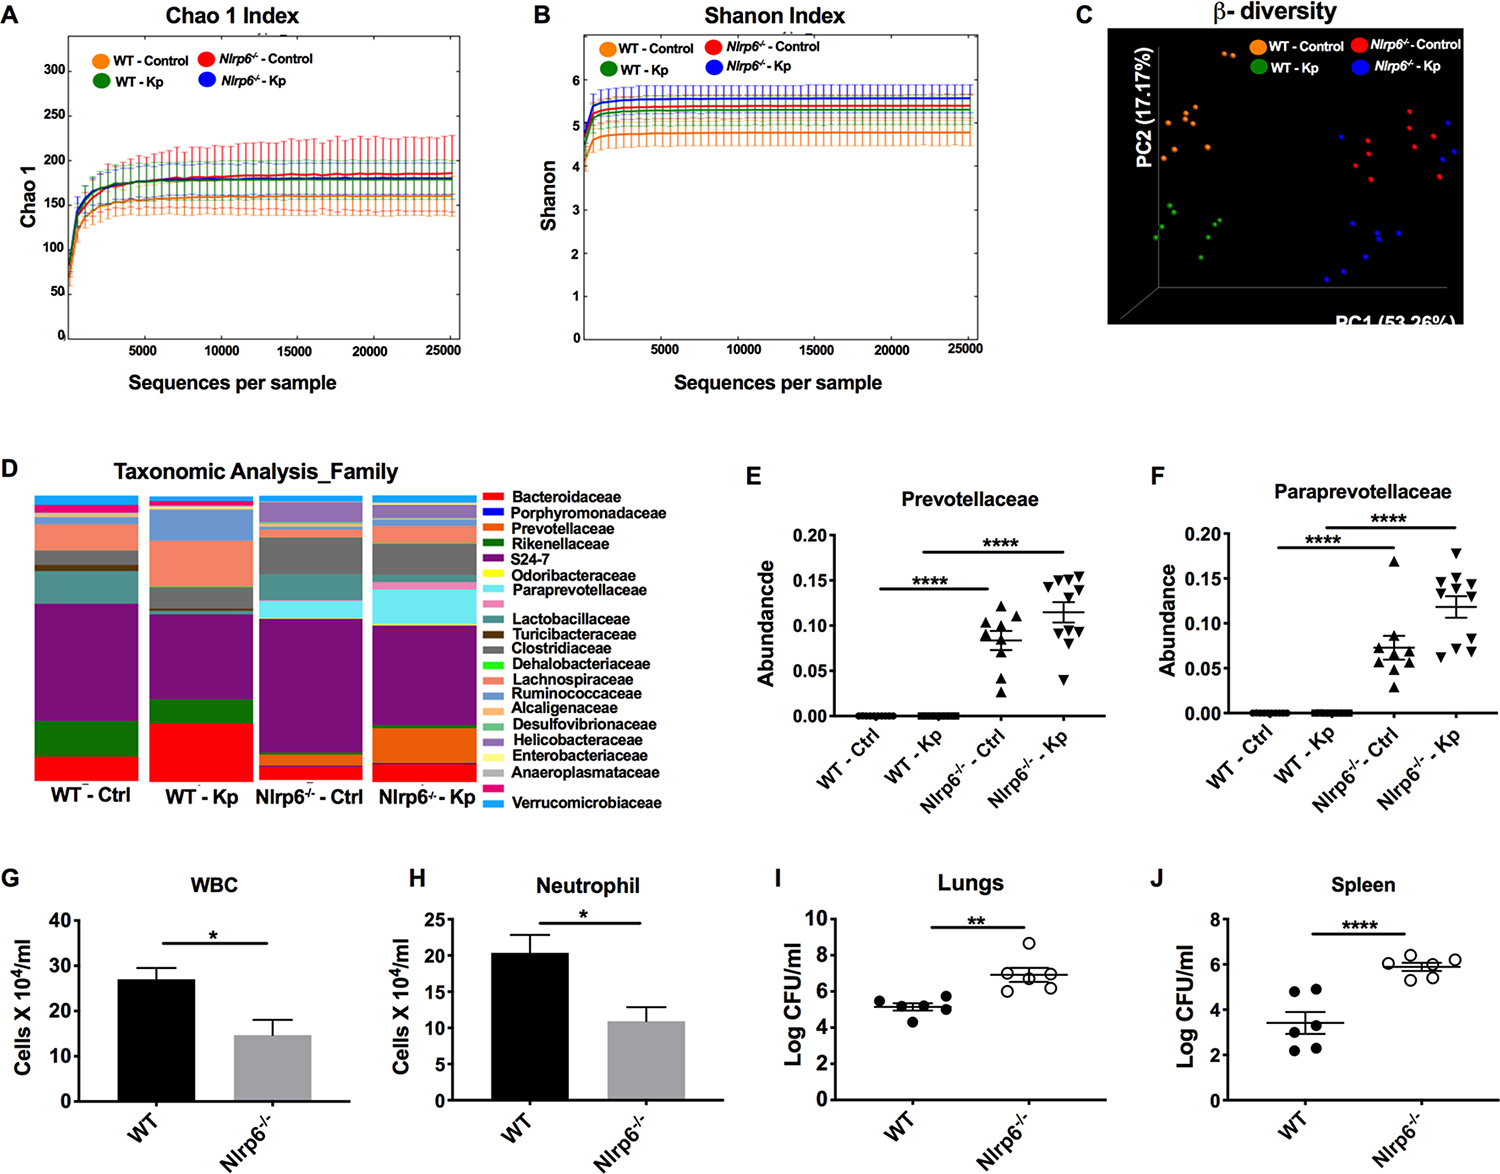
Figure 3. Importance of the gut microbiota in Nlrp6−/− mice for bacterial clearance and neutrophil influx following Kp infection.

(A–F) WT and Nlrp6−/− mice were infected with Kp (103 CFU/mouse) or PBS. At 48 h post-infection, fecal samples were collected and the microbiota was analyzed using 16S rDNA-based phylogenetics method. Rarefaction curves calculated for Chao1 (A) and Shannon index (B) are shown. (C) PCoA plots based on the weighted Unifrac distance matrix are presented. (D) Heat maps showing taxonomic composition of microbial communities at the family level. ANOSIM, R= 0.786, P=0.001. Relative abundance of prevotellaceae (E) and pararevotellaceae (F) families is presented. (n=10 mice/group). #, ## denotes orders with unknown families. (G–J) WT and Nlrp6−/− mice were co-housed for 4 weeks and inoculated with Kp (103 CFU/mouse). Total number of white blood cells (G), neutrophils (H) in BALF and bacterial burden in lungs (I) and spleen (J) were enumerated at 48 h post-infection. (n = 5–6/group). Statistical significance was determined by ANOVA (followed by Tukey’s multiple comparisons) (E, F) and unpaired t-test (G–J). *, p<0.05; **, p<0.001; ****, p<0.0001.
