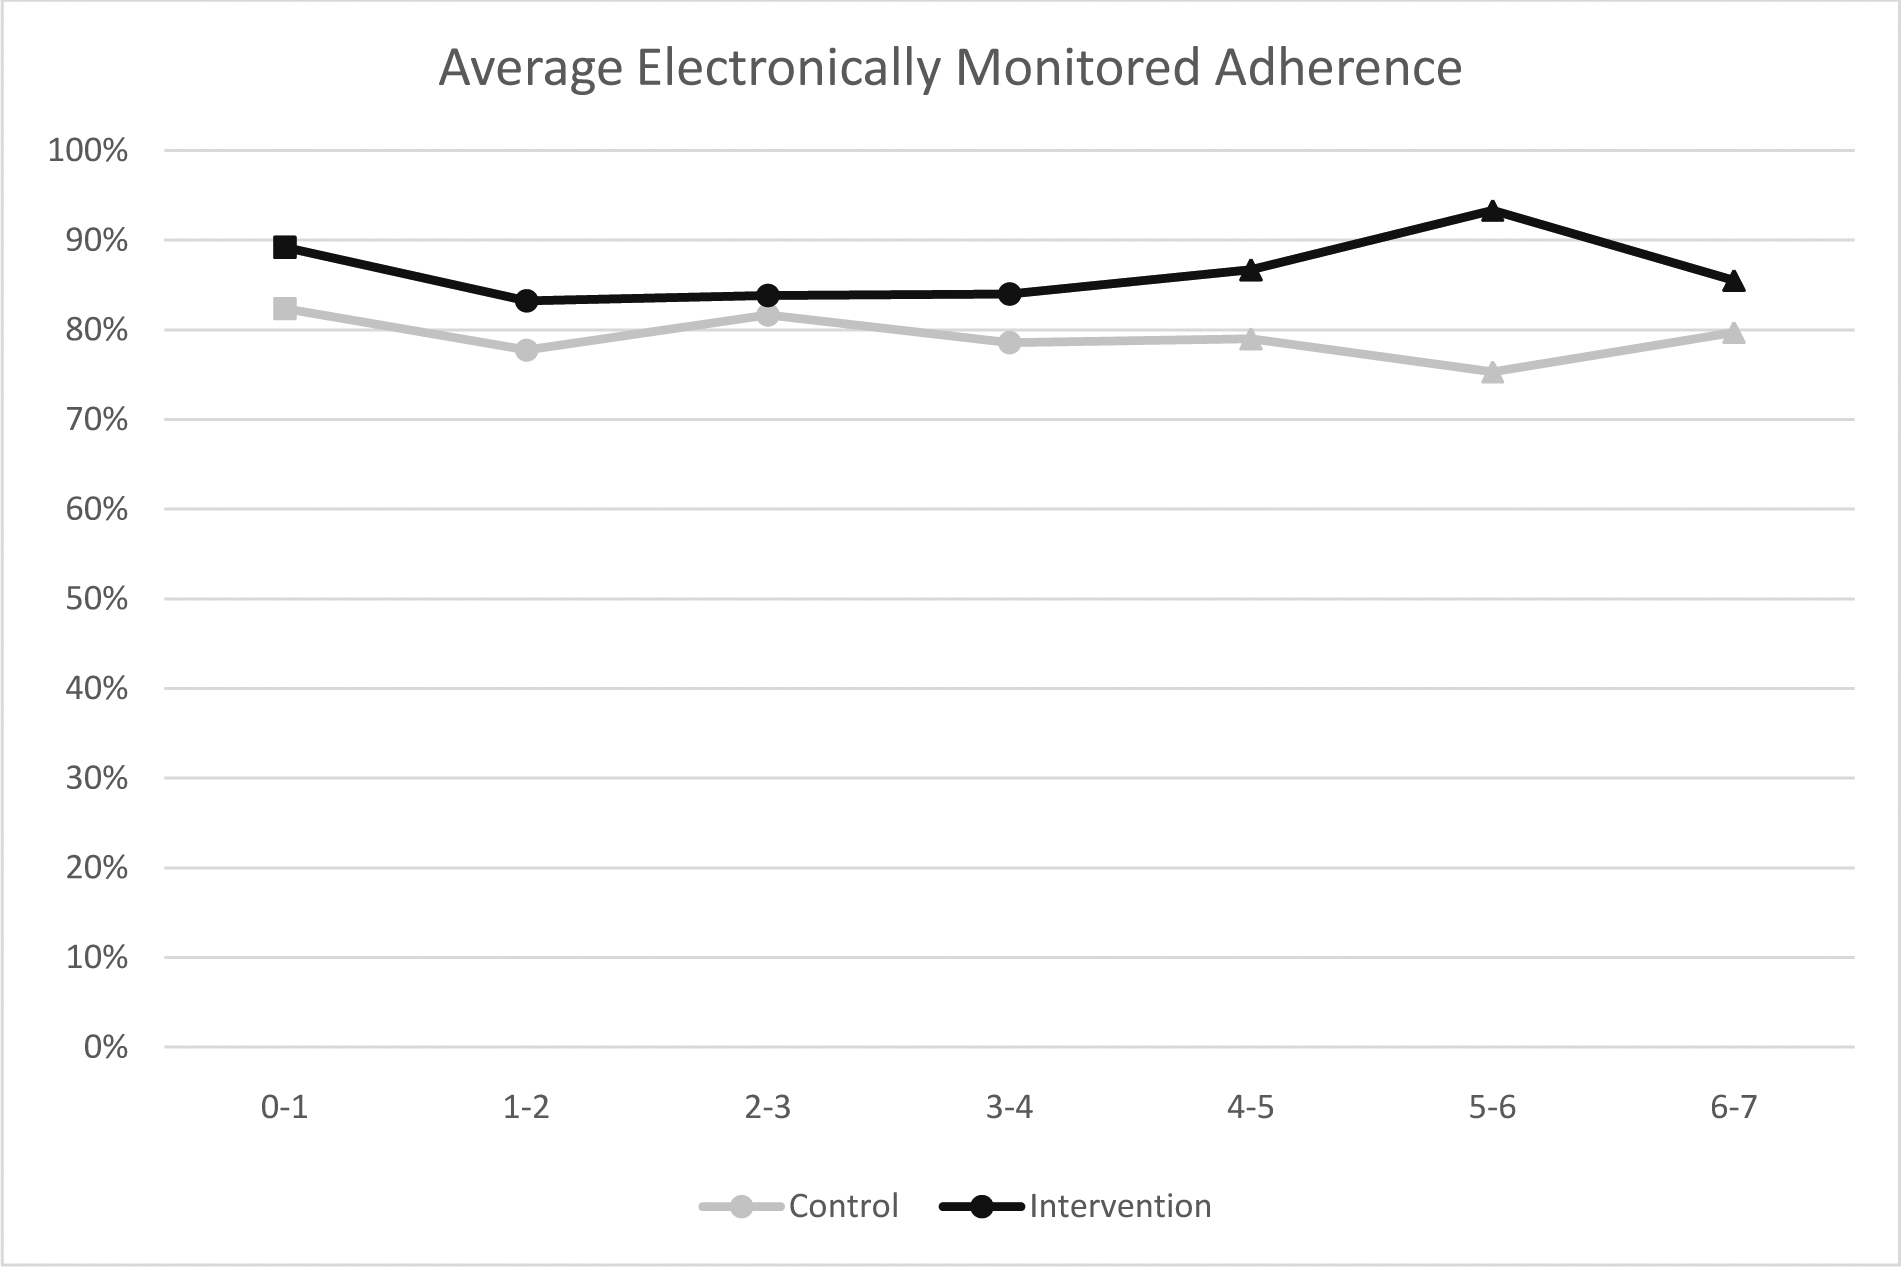
Figure II.

Electronically Monitored Adherence Over Time (in Months) by Study Arm
Note. Squares on the lines designate the preintervention period, circles the intervention period, and triangles the post-intervention period. Repeated-measures regression for intervention vs. control difference in the post-intervention period: b (95% CI) = 9.24 (−0.55, 19.03), p = 0.06 (Cohen’s effect size d = .44).
Regression results and average adherence are weighted to account for presence of data at each month, among those with data at 0–1 month.
