Figure 2.
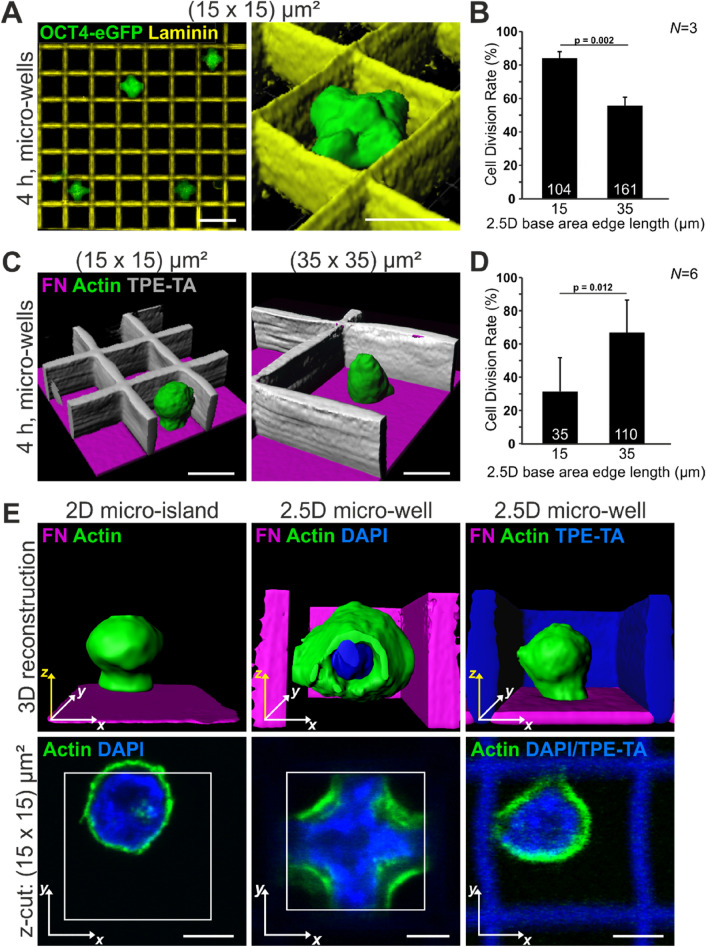
Cell shape is linked to cell division rate. (A) Single OCT4-eGFP expressing mESCs (green) in laminin-coated 2.5D micro-wells (LN, yellow) with 15 µm base area edge length four hours after seeding. The nuclei (marked by OCT4) exhibit a cross-shaped morphology. Scale bars: 10 µm and 15 µm for the 3D reconstruction. (B) CDR on LN significantly decreases with increasing micro-well size. (C) 3D reconstructions of mESCs in micro-wells with non-adhesive walls (TPE-TA, grey) and a FN-coated bottom (magenta). The cells exhibit a round morphology irrespective of the well size. Scale bars: 10 µm (D) The CDR increases with increasing micro-well size, as on 2D islands. (E) 3D reconstructions (upper row) and single optical sections (lower row) of mESCs four hours after seeding. Actin (green) and the nucleus (DAPI, blue) were stained. On 2D micro-islands and in 2.5D micro-wells with non-adhesive walls cells and nuclei have a round morphology. Cells (and nuclei) in 2.5D micro-wells with adhesive walls adopt a cross-shaped morphology with prominent actin arcs. Scale bars: 5 µm. Graphs show mean ± one s.d. from N = 3 independent experiments. The number of analyzed cells is given in the individual bars; p value was determined by two-tailed student’s t-test.

