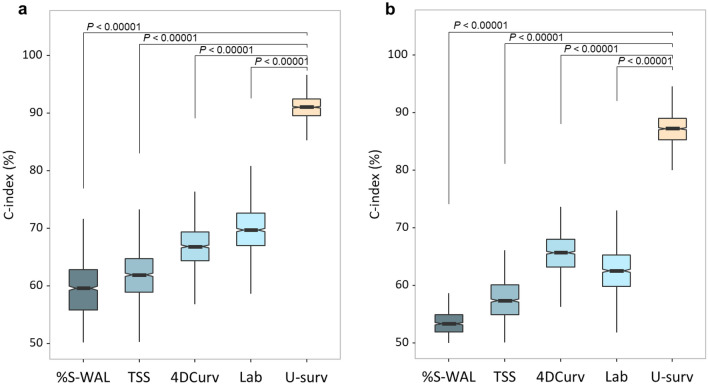
Figure 1.
Performance of U-survival and the reference predictors in the prediction of COVID-19 progression and mortality for the subcohorts of patients for whom all the predictors were available. (a,b) Notched boxplots, in which the middle lines and the notches show the means and 95% confidence intervals, of the C-index values of U-survival and the reference predictors in the prediction of disease progression (a), where the outcome is defined as ICU admission or death, and in the prediction of mortality (b), where the outcome is defined as death. The C-index values were obtained by per-patient bootstrapping with 1000 replicates. The P values were obtained by use of a bootstrap hypothesis test. %S-WAL percentage of well-aerated lung parenchyma, TSS total severity score, 4DCurv 4D-curvature, Lab laboratory tests, U-surv U-survival.

