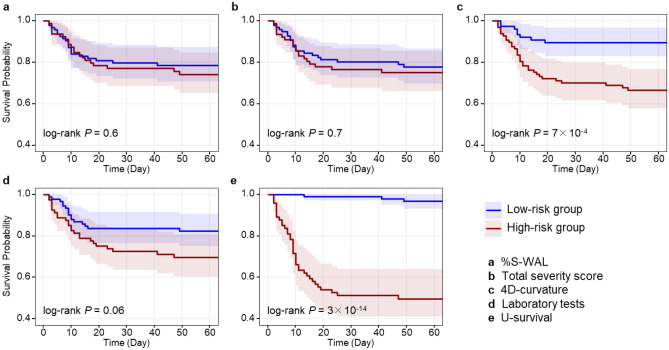
Figure 2.
Kaplan–Meier survival curves of COVID-19 patients stratified into low- and high-risk groups based on the mortality predictions in Fig. 1b. The estimated survival curves for the low- and high-risk groups are shown in blue and red, respectively, with shaded areas representing the 95% confidence interval. The P values were obtained by application of the log-rank test to the two survival curves. %S-WAL percentage of well-aerated lung parenchyma.

