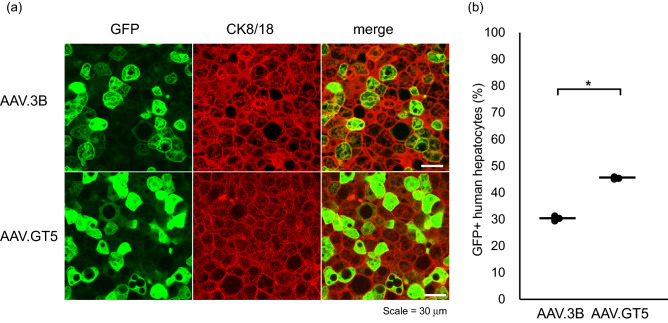
Figure 4.
(a) Visualization of AAV vectors transduction of human hepatocytes in a chimeric mouse liver. Representative images of hepatocytes in PXB mice that received 1.0 × 10¹¹ vg/mouse of AAV3B or AAV.GT5 expressing GFP. Green stain, GFP; red stain, human hepatocytes (CK8/18 +). Scale bar represents 30 μm. (b) Comparison of transduction efficacies of AAV3B and AAV.GT5 by quantifying the percent GFP + human hepatocytes in liver sections. The black circles represent the efficiency for each mouse, and the bars represent the average. *P = 0.00001.

