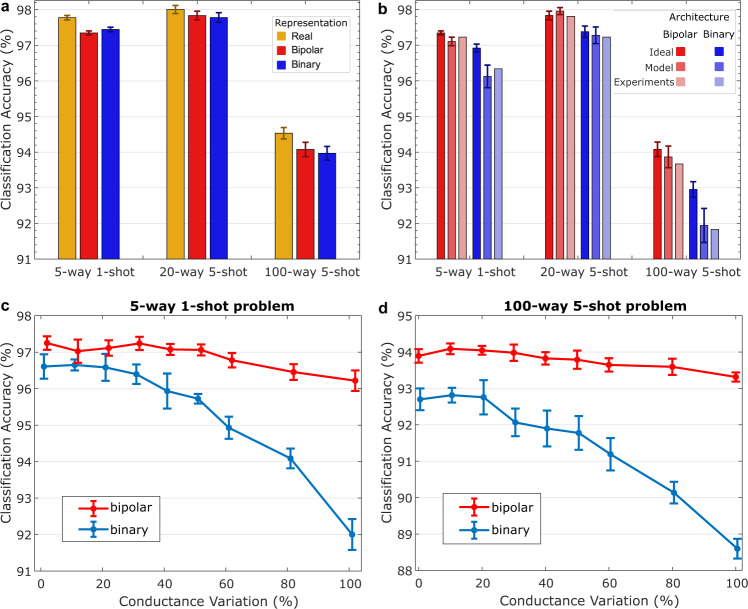
Fig. 5. Experiments on Omniglot classification.
a Average software classification accuracy with the real, bipolar, and binary vector representations on three problems, each using the approximate sharpening function (i.e., the regular absolute), and the precise similarity function (i.e., the cosine) over 10 test runs each containing 1000 few-shot episodes (effectively 10,000 episodes); these capture the net effect of changing vector representations in software. b Classification accuracy results with the hardware-friendly inference architecture on an ideal crossbar without any PCM variations, a crossbar simulated with the PCM model (see Methods), and the actual experiments with the PCM devices (see Methods). The ideal and the PCM model simulations are conducted over 10 test runs each containing 1000 few shot episodes (effectively 10,000 episodes). The experiments were conducted over one test run containing 1000 episodes. c Classification accuracy as a function of percentage of device conductance variation in the PCM model with bipolar and binary as architectures for the 5-way 1-shot problem, and the (d) 100-way 5-shot problem. The error bars represent one standard deviation of sample distribution on either directions in all plots.

