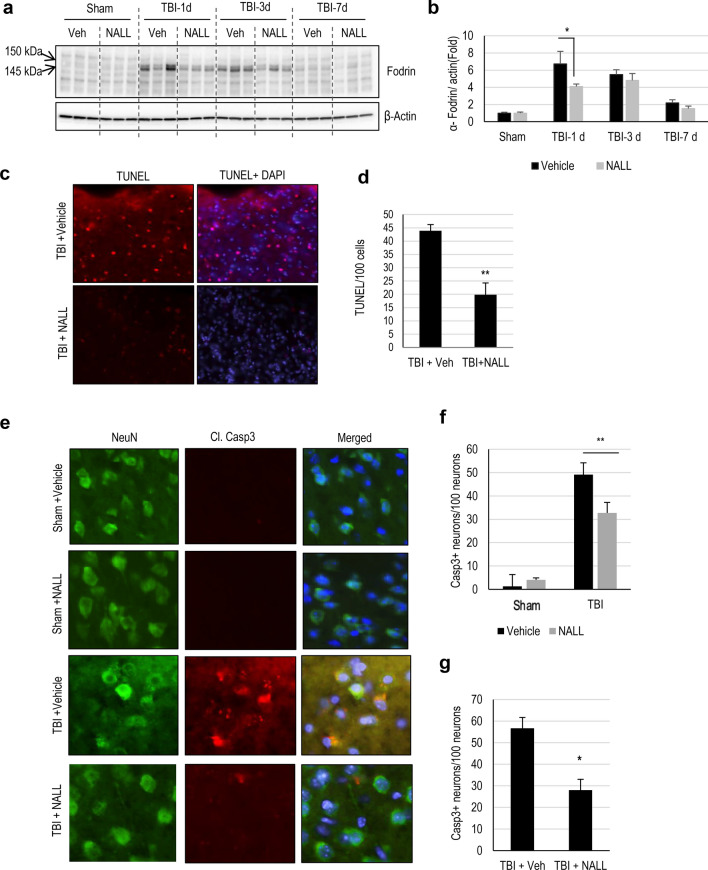
Figure 2.
NALL attenuates cortical cell death after TBI. (a) Western blot of cortical tissue lysates from sham and TBI mice fed with NALL or vehicle to detect α-fodrin breakdown products. (b) Corresponding densitometric analysis of cleaved bands of α-fodrin with respect to β-actin. Data are presented as mean ± SEM. n = 5, *p < 0.05 (Two-way ANOVA with Bonferroni posttests). (c) 20 × representative images of vehicle or NALL-fed mouse cortical brain sections at 1 day post- post-TBI stained for TUNEL and (d) corresponding quantification. Data are presented as mean ± SEM. n = 5, **p < 0.01 (Two-tailed Student’s t-test). (e) 20 × IF representative images of vehicle or NALL-fed mouse cortical brain sections at 1 day post- post-TBI stained for cleaved caspase-3 and NeuN and (f) corresponding quantification, represented as number of cleaved caspas-3 + neurons/100 neurons. Data are presented as mean ± SEM. n = 5/group, **p < 0.01 (Two-way ANOVA with Sidak posttests). (g) Quantification of cleaved caspase 3 positive neurons in hippocampal brain sections of vehicle or NALL-fed mice at 1 day post-TBI, represented as cleaved caspase-3 + neurons/100 hippocampal neurons. Data are presented as mean ± SEM. n = 5/group *p < 0.05 (Two-tailed Student’s t-test).

