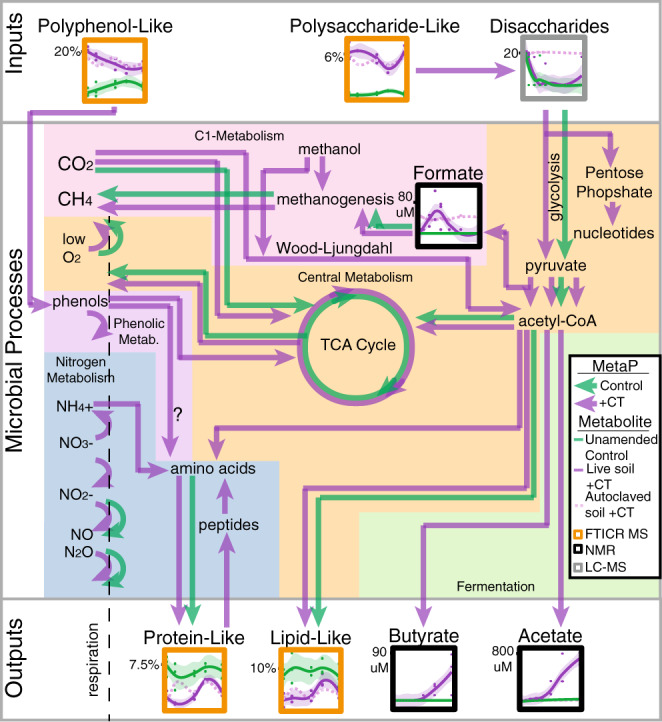
Fig. 7. Coupled metaproteome and metabolite data indicated polyphenol amendment did not inhibit soil microbial metabolism.

Arrows indicate metaproteome gene expression data, with green representing unamended and purple indicating CT-amended pathways. Metabolite dynamics are shown in boxed graphs, with lines indicating average signal for live CT (n = 3 individual biological replicates, solid purple), and unamended control (n = 3 individual biological replicates, green) microcosms with shaded areas including the 95% confidence interval and individual data points plotted, and autoclaved CT soil (dotted light purple). The methodology used to detect the metabolite is highlighted by box color (noted in the graphical legend), with FTICR-MS (orange) data given as percent of identified peaks, NMR (black) as umol, and LC–MS (gray) as log2(peak areas). Nitrogen metabolism (blue box) is discussed in Supplementary Note 4.
