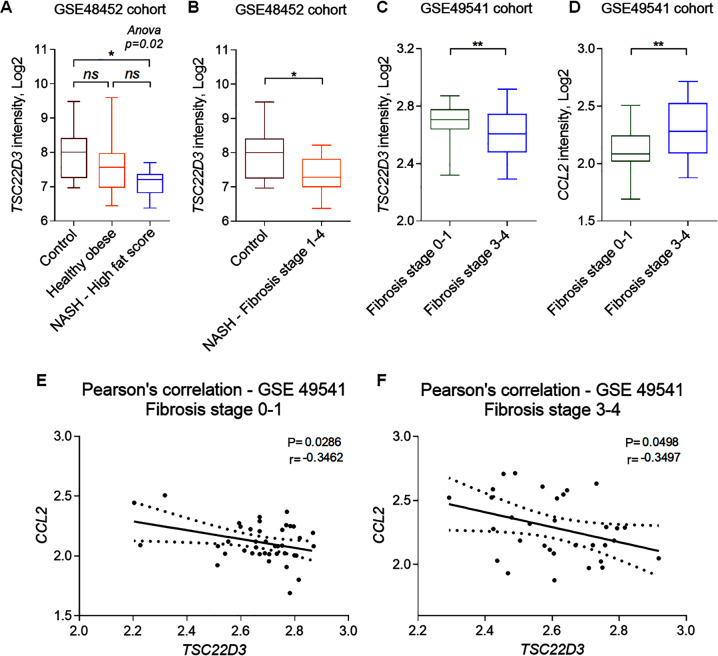
Fig. 7. GILZ is downregulated in patients with LF.
TSC22D3 and CCL2 mRNA expression was analyzed in liver samples from NAFLD patients, according to GSE48452 (NASH patients) and GSE49541 (NAFLD patients) cohorts accessed in Gene Expression Omnibus. A, B TSC22D3 mRNA expression in NASH patients. Samples were classified as A high fat score when presenting a score of ≥70 (n = 9) and B fibrosis stages 1–4, representing the samples in this score range (n = 14). C, D TSC22D3 (C) and CCL2 (D) gene expression in NAFLD patients with mild (stages 0–1; n = 40) and advanced (stages 3–4; n = 34) fibrosis. E, F Pearson correlation between TSC22D3 and CCL2 mRNA expression in NAFLD patients. E Pearson correlation coefficient in NAFLD patients with mild (stages 0–1) and (F) advanced (stages 3–4) fibrosis. Data are presented as a box and whiskers plot. *p < 0.05, **p < 0.01.

