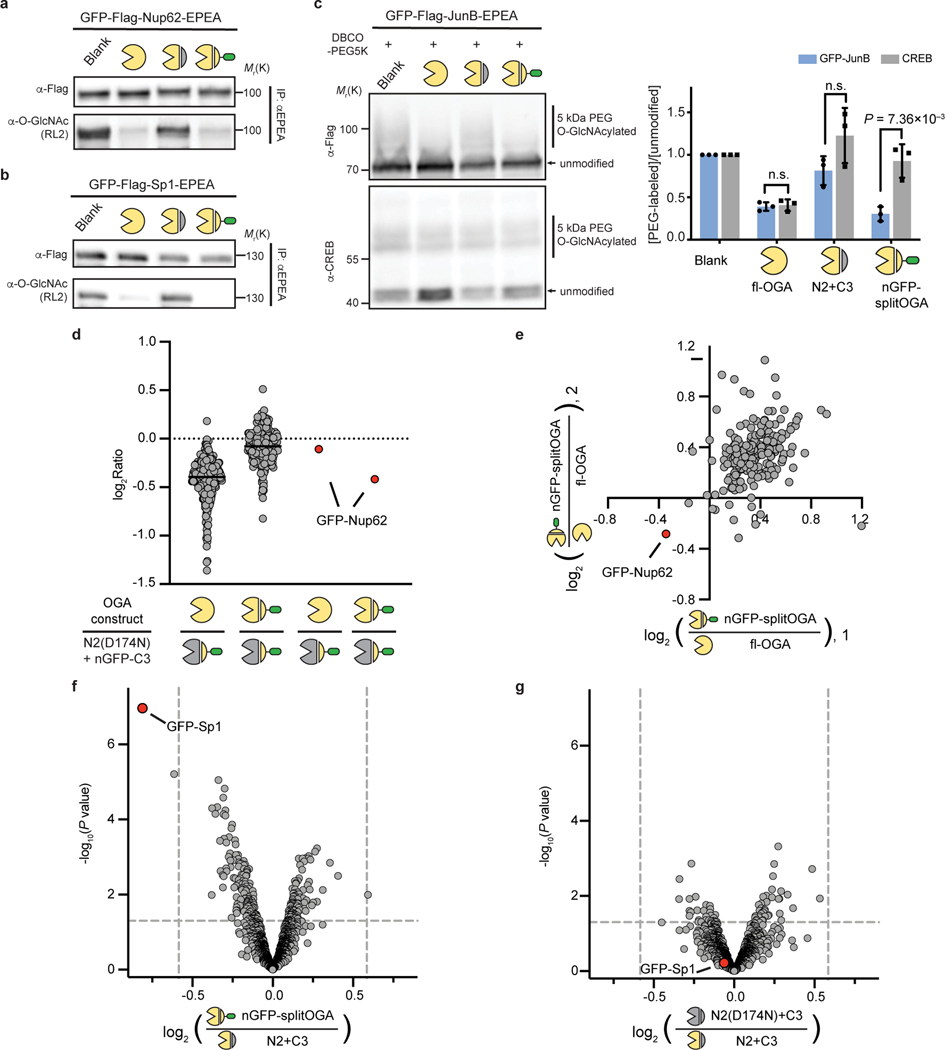
Fig. 3 |. The nanobody-fused split OGA is general for protein-selective deglycosylation on various O-GlcNAcylated proteins.
a–c, nGFP-splitOGA shows deglycosidase activity on GFP-tagged Nup62 (a), Sp1(b), and JunB (c). In a and b, the target protein was enriched and blotted for O-GlcNAc by RL2. In c, samples were subjected to a mass-shift assay with 5kDa DBCO-PEG. O-GlcNAcylation levels were measured by the ratio between the intensity of mass-shifted bands and unmodified bands. The data in a-c are representative of three biological replicates. Quantification is presented as mean ± s.d. of n = 3 independent experiments. d, e, Log2 ratios of changes of enriched O-GlcNAcylated protein abundance of fl-OGA and nGFP-splitOGA versus its inactive form treated cells respectively (d), and nGFP-splitOGA versus fl-OGA-treated cells (e) in the presence of GFP-Nup62. The black solid lines refer to the median of each group. f, g, Volcano plots illustrating the comparison of enriched O-GlcNAcylated proteins of nGFP-splitOGA (f) or of inactive (g) versus split OGA-treated cells co-expression of GFP-Sp1. P = 0.05 and ±1.5-fold change are denoted by gray dashed lines as significance threshold. Each point represents an individual identified protein of two (d, e) or four (f, g) independent biological replicates. GFP-Nup62 or GFP-Sp1 are indicated by the red dot. Symbols represent the corresponding OGA constructs as indicated. A two-tailed, unpaired Student’s t-test was used for statistical analysis in c, f and g. n.s., not significant.

