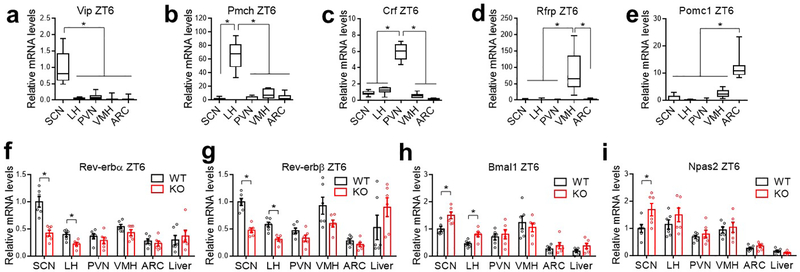
Extended Data Figure 4. Gene expression analysis at different brain regions.
(a-e) RT-qPCR analysis of the indicated brain region-specific marker genes for the brain regions isolated from both WT and KO mice at ZT6 at the age of 3 months old, n = 12 mice. Box-plots center lines, limits, and whiskers represent the median, quartile, and minimum/maximum values, respectively. (f-i) RT-qPCR analysis comparing WT and KO mice at ZT6 at the age of 3 months old, n = 6 mice. Data are mean ± S.E.M. * p < 0.05 by two-way ANOVA or two-sided t-test. Statistical details were in Supplementary Table 1.

