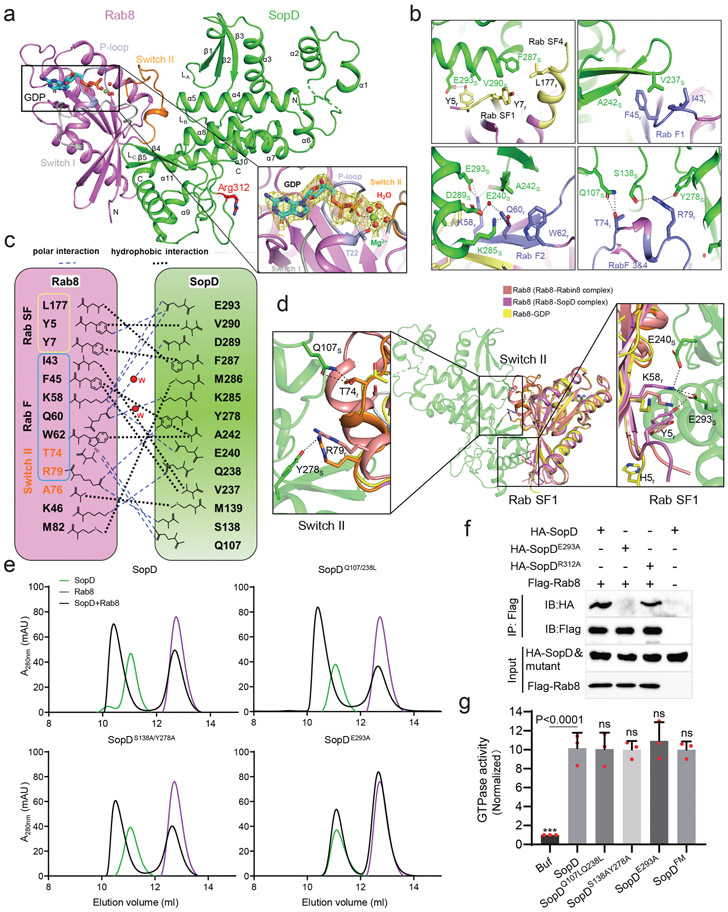
Figure 3. Crystal structure of the SopD/Rab8 complex and functional analyses of the binding interface.
(a) Ribbon representation of the overall structure of the SopD/Rab8 complex. The secondary structure features of SopD, as well as the position of the switch I (gray), switch II (orange), and P-loop (light blue) regions of Rab8 are indicated. The key catalytic residue arginine 312 in SopD is shown as stick and highlighted in red. The GDP is denoted as stick (cyan), water molecules and Mg2+ are represented as red and green spheres, respectively. The inset shows the simulated annealing omit maps (yellow mesh) for GDP, water molecules and Mg2+ in the nucleotide-binding pocket of Rab8 from the SopD/Rab8 complex (contoured at 1.5 σ). The T22 residue of Rab8, which forms a coordinate bond with Mg2+, is shown as stick. (b and c) Depiction of the interactions between SopD (green) and Rab8 (violet) with interacting residues shown as sticks. RabSF and RabF motifs are depicted in yellow and light blue, respectively. Polar interactions are shown in black dashes. The schematic representation of the interactions between Rab8 and SopD is shown in (c), where the polar interactions are shown as blue dashed lines, the water molecules as red balls, and the hydrophobic interactions as black dashed lines. (d) Structure superimposition of Rab8 as it appears in the Rab8/SopD complex, with Rab8 as it appears in complex with Rabin8 or bound to GDP. The inset shows the conformational changes of key amino acids in Rab8 after binding to SopD. (e) Size-exclusion chromatography analyses of SopD carrying mutations in amino acids defining its interface with Rab8. The SDS-PAGE analyses of the elution fractions are shown in Extended Data Fig. 7. (f) Co-immunoprecipitation analyses of the interaction of SopD and its indicated mutants with Rab8 after transient expression in HEK-293T cells. This experiment was conducted at least three times with equivalent results. (g) GAP activity of the indicated SopD mutants with substitutions in amino acid residues involved in its interface with Rab8. Data represent the ratio of GTPase activity observed in the presence or absence of SopD and are the mean ± SD from three independent experiments; ns, not significant P > 0.05; *** P < 0.001 (one-way ANOVA with Dunnett’s method).

