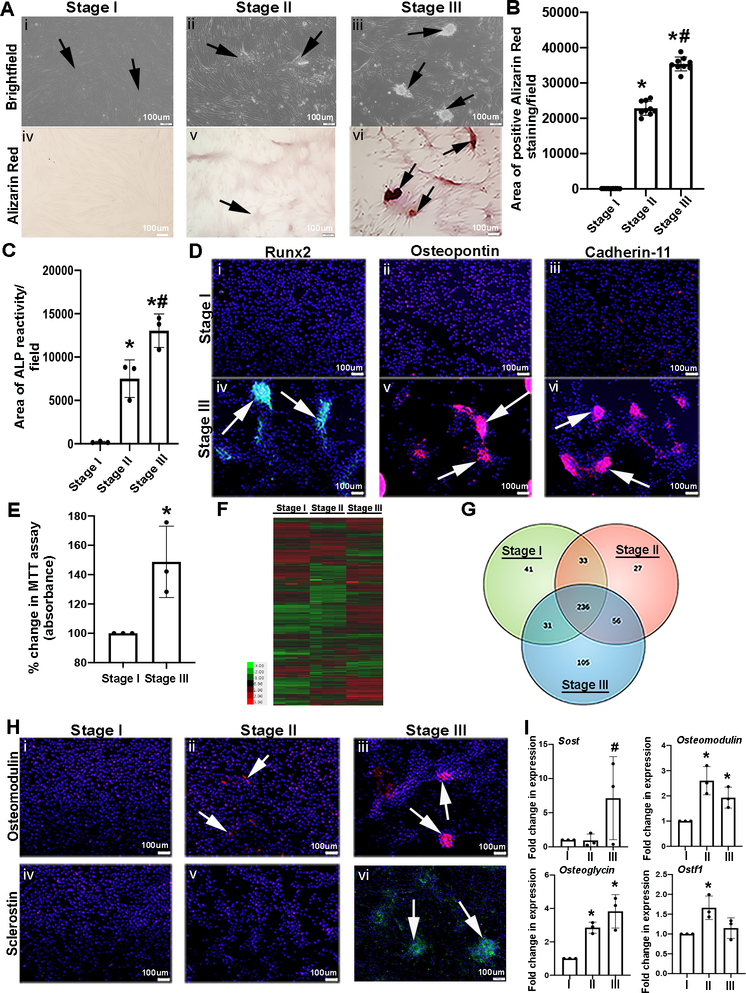
Figure 1. In vitro model of VIC calcific nodule formation.
(A) pAVICs were plated on glass to stimulate the formation of calcific nodules. Brightfield (i-iii) and Alizarin Red stained images (iv-vi) of pAVICs at Stage I (~5 days), Stage II (~8–9 days), Stage III (~12–14 days). Arrows depict quiescent (Stage I), pre-calcific (Stage II), and calcific nodules (Stage III) (n=3). (B) Graph showing quantification of the area positive for Alizarin Red staining/microscopic field. The Y axis indicates calibrated arbitrary units of area based on selected montages in Image J. Quantification was performed using 3 biological replicates, with 3 different field of views from each replicate. P-value by one-way ANOVA = 6.3E-08. Adjusted p-values using post-hoc pairwise analysis: *Stage I vs Stage II 7.7E-06, *Stage I vs Stage III 1.8E-06, #Stage II vs Stage III 0.0004. (C) Graph showing area of positive Alkaline Phosphatase (ALP) reactivity/field at Stages I-III (n=3). P-value by one-way ANOVA = 0.0003. Adjusted p-values using post-hoc pairwise analysis: *Stage I vs Stage II 0.004, *Stage I vs Stage III 0.0003, #Stage II vs Stage III 0.02. (D) Immunofluorescence images to detect Runx2 (green), Osteopontin (red), and Cadherin-11 (red) protein expression at Stages I and III. DAPI highlight nuclei in blue (n=3). (E) Percent change in MTT assay (absorbance) of pAVICs harvested at Stages I and III (n=3). *P-value using corrected Mann-Whitney: 0.03. (F) Heat map and (G) Venn diagram of RNA-Seq analysis (n=3). (H) Immunofluorescence images to detect Osteomodulin (red) and Sclerostin (green) protein expression in pAVICs fixed at Stages I, II and III (n=3). (I) qPCR analysis of osteogenic markers: Sclerostin (Sost), Osteomodulin, Osteoglycin, and Osteoclast Stimulating Factor 1 (Ostf1) (n=3). P-values for datasets by one-way ANOVA: Sclerostin n/s, Osteomodulin 0.008, Osteoglycin 0.004, Ostf1 0.027. Adjusted p-values using post-hoc pairwise analysis: Sclerostin: Stage I vs Stage II 0.6, Stage I vs Stage III 0.2, #Stage II vs Stage III 0.03. Osteomodulin: *Stage I vs Stage II 0.0006, *Stage I vs Stage III 0.01, Stage II vs Stage III 0.09. Osteoglycin : *Stage I vs Stage II 9.4E-05, *Stage I vs Stage III 0.001, Stage II vs Stage III 0.2,. Ostf1: *Stage I vs Stage II 0.004, Stage I vs Stage III 0.5, Stage II vs Stage III 0.09.

