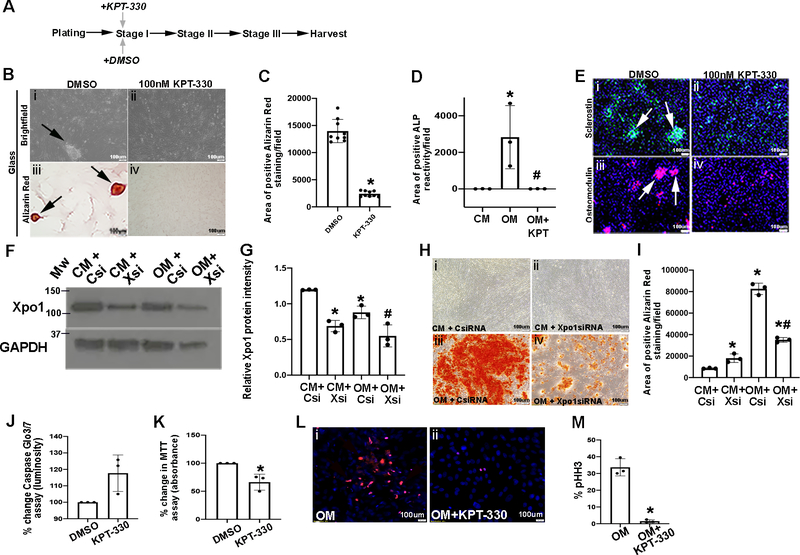
Figure 2. KPT-330 prevents calcific nodule formation and reduces proliferation.
(A) Experimental timeline. (B) Brightfield (i,ii) and Alizarin Red (iii,iv) images from pAVICs cultured on glass and treated with DMSO or 100nM KPT-330 at Stage I. Arrows, Alizarin Red positive nodules (n=3). (C) Quantification of positive Alizarin Red stained area/field in pAVICs treated with 100nM KPT-330 at Stage I (n=3). *P-value using corrected Mann-Whitney: 0.03. The Y axis indicates calibrated arbitrary units of area based on selected montages in Image J. (D) Area of positive ALP reactivity in pAVICs cultured in complete media (CM), osteogenic media (OM), or treated with KPT-330 in the presence of OM (n=3). The Y axis indicates calibrated arbitrary units of area based on selected montages in Image J. P-values using corrected Mann-Whitney: *CM vs OM 0.03, #OM vs OM+KPT 0.03, CM vs OM+KPT 0.3. (E) Immunofluorescence of pAVICs to detect Sclerostin (green) or Osteomodulin (red) protein expression (arrows showing calcified nodules) after DMSO treatment (n=3). (F) Western Blot analysis and densitometric quantitation (G) to confirm Xpo1 knockdown by Xsi compared to Csi (n=3). P-values using corrected Mann-Whitney: *CM+Csi vs OM+Csi 0.03, *CM+Csi vs CM+Xsi 0.03, #OM+Csi vs OM+Xsi 0.03. (H) Alizarin Red staining of pAVICs cultured in CM or OM, and transfected with control (Csi) or siRNA against Xpo1 (Xsi) (n=3). (I) Quantification of Alizarin Red stained area/field from H (n=3). The Y axis indicates calibrated arbitrary units of area based on selected montages in Image J. P-values using corrected Mann-Whitney: *CM+Csi vs OM+Csi 0.03, *CM+Xsi vs OM+Xsi 0.03, *CM+Csi vs CM+Xsi 0.03, #OM+Csi vs OM+Xsi 0.03. (J) Percent change in Caspase-glo 3/7 luminosity (cell death) in pAVICs treated with DMSO or 100nM KPT-330 plated on glass (n=3). P-value using corrected Mann-Whitney 0.1. (K) Percent change in MTT assay performed in pAVICs treated with DMSO or 100nM KPT-330 plated on glass (n=3). *P-value using corrected Mann-Whitney 0.03. (L) Immunofluorescence of pHH3 expression in pAVICs cultured in OM and treated with DMSO or 100nM KPT-330 (n=3). (M) Quantification of data presented in U, V. *P-value using corrected Mann-Whitney: 0.03.

