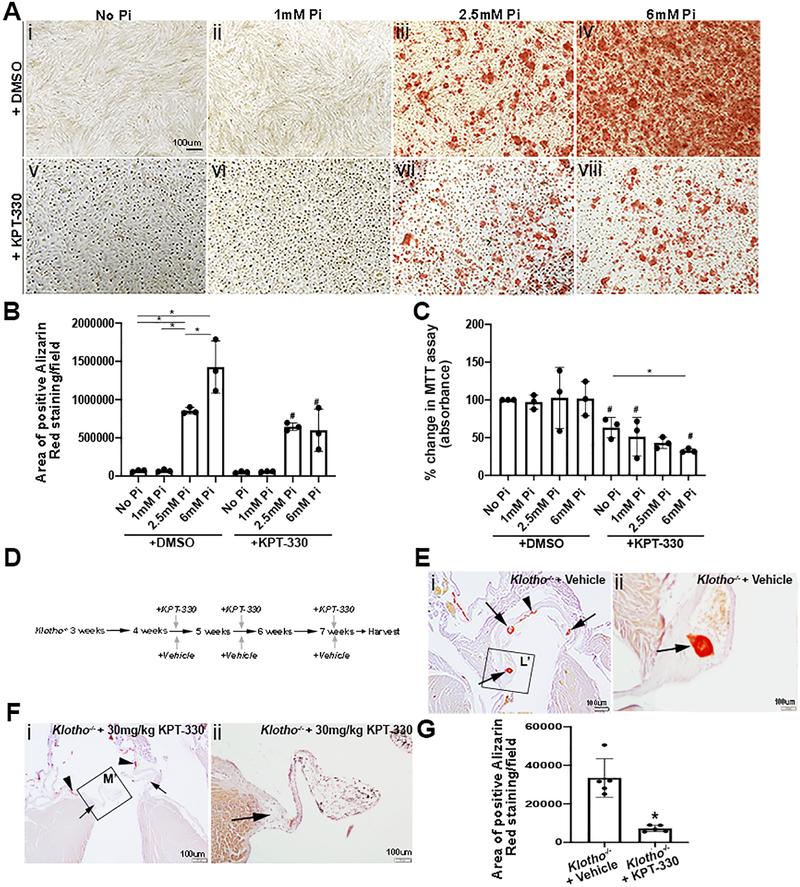
Figure 4. KPT-330 prevents aortic valve calcification in Klotho−/− mice.
(A) Alizarin Red staining of pAVICs treated with no phosphate (Pi) (i,v), 1mM Pi (ii,vi) 2.5mM Pi (iii,vii) and 6mM Pi (iv,viii) in the absence (i-iv) and presence of 100nM KPT-330 (v-viii) for 4–5 days. (B) Quantification of positive Alizarin Red stained area/field in untreated and treated pAVICs, *indicates comparison to indicated Pi concentration, # indicates comparison to DMSO-treated at the same Pi concentration (n=3). The Y axis indicates calibrated arbitrary units of area based on selected montages in Image J. P-values using corrected Mann-Whitney: *No Pi vs 2.5 mM Pi 0.03, *No Pi vs 6 mM Pi 0.03, *1 mM Pi vs 2.5 mM Pi 0.03, *2.5 mM Pi vs 6 mM Pi 0.03, #2.5 mM Pi vs 2.5 mM Pi+KPT 0.03, #6 mM Pi vs 6 mM Pi+KPT 0.03. (C) Percent change in MTT assay of untreated and treated pAVICs, *indicates comparison to indicated Pi concentration, #indicates comparison to DMSO-treated at the same Pi concentration (n=3). *P-values using corrected Mann-Whitney: No Pi vs No Pi+KPT 0.03, 1 mM Pi vs 1 mM Pi+KPT 0.03, 2.5 mM Pi vs 2.5 mM Pi+KPT 0.03, 6 mM Pi vs 6 mM Pi+KPT 0.03, No Pi+KPT vs 2.5 mM Pi+KPT 0.03, No Pi+KPT vs 6 mM Pi+KPT 0.03. (D) Schematic showing experimental treatment design in Klotho−/− mice. (E) Low and high magnification of Alizarin Red stained tissue sections from Klotho−/− mice treated with vehicle. Arrows show presence of annular calcification and arrow heads show vascular calcification. (F) Low and high magnification of Alizarin Red tissue sections from Klotho−/− mice treated with 30 mg/kg KPT-330. Arrows show absence of annular calcification and arrow heads show vascular calcification (n=6). (G) Quantification of positive Alizarin Red stained area/field within the aortic valve annular region of vehicle and KPT-330 treated Klotho−/− mice (n=5). *P-value using corrected Mann-Whitney: 0.002. The Y axis indicates calibrated arbitrary units of area based on selected montages in Image J.

