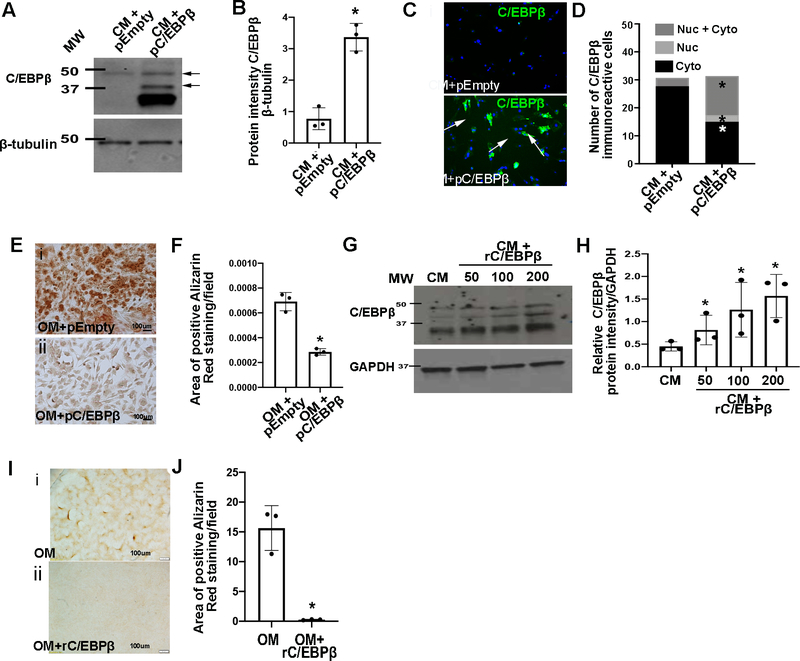
Figure 6. C/EBPβ overexpression prevents calcification of VICs.
(A) Western Blot analysis and densitometric analysis (B) of Western Blot from pAVICs transfected with pcDNA3-C/EBPβ (pC/EBPβ) or empty pcDNA3 (pEmpty) (n=3). *P-value using corrected Mann-Whitney: 0.03. (C) Immunofluorescence and quantitation (D) of nuclear/cytoplasmic localization of C/EBPβ in pAVICs following transfection with pC/EBPβ or empty pcDNA3 in complete media (CM), (n=3). *P-value using corrected Mann-Whitney: empty pcDNA3 vs pC/EBPβ cytoplasmic 0.03, empty pcDNA3 vs pC/EBPβ nuclear 0.03, empty pcDNA3 vs pC/EBPβ cytoplasmic+nuclear 0.03. (E) Alizarin Red stained images and quantification (F) from pAVICs cultured in OM and transfected with pEmpty or pC/EBPβ (n=3). *P-value using corrected Mann-Whitney: 0.03. The Y axis indicates calibrated arbitrary units of area based on selected montages in Image J. (G) Western Blot and densitometric analysis (H) of C/EBPβ levels from pAVICs treated with recombinant C/EBPβ protein (rC/EBPβ) (n=3). *P-value using corrected Mann-Whitney: CM vs 50 0.03, CM vs 100 0.03, CM vs 200 0.03. (I) Alizarin Red images and quantification (J) of positive Alizarin red stained area/field of pAVICs cultured in OM alone, or OM + rC/EBPβ (n=3). *P-value using corrected Mann-Whitney: 0.03. The Y axis indicates calibrated arbitrary units of area based on selected montages in Image J. Molecular weights (MW) are indicated in kDa.

