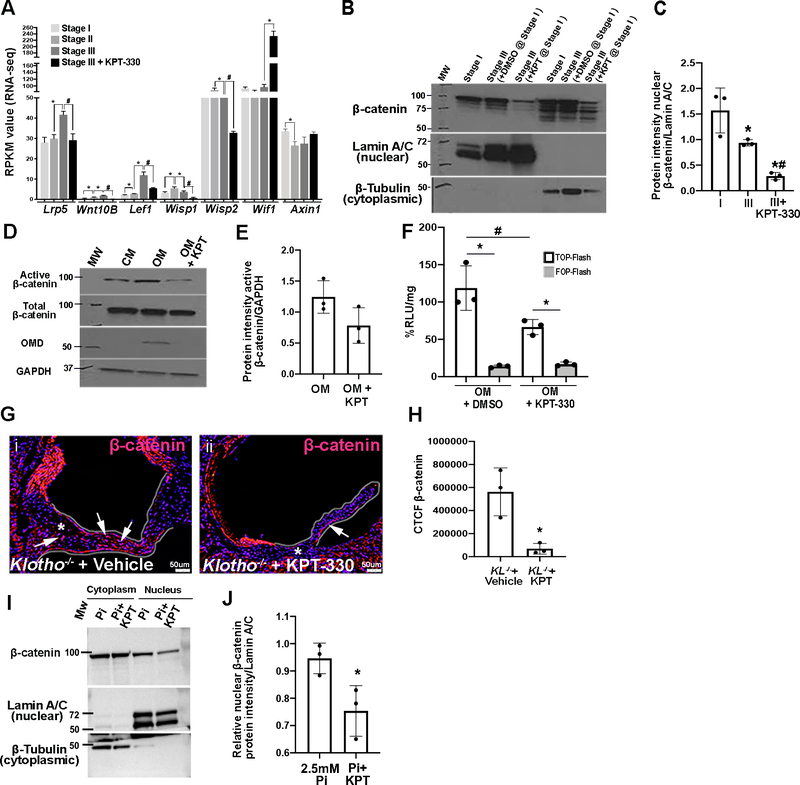
Figure 7. KPT-330 represses canonical Wnt signaling in pAVICs.
(A) RPKM values obtained from RNA-Seq data for Wnt signaling mediator and regulatory genes, *indicates comparison to previous time point, #indicates comparison to Stage III (Wnt activators or downstream effectors – Lrp5, Wnt10b, Lef1, Wisp1, Wisp2; Wnt inhibitors- Wif1, Axin1) (n=3). P-values: ≤ 0.01–0.05. (B) Western Blot analysis and quantitation (C) of β-catenin expression in pAVICs harvested at Stage I, or Stage III in the presence and absence of 100nM KPT-330 (n=3). P-value using corrected Mann-Whitney: *Stage I vs Stage III 0.03, #Stage III vs Stage III+KPT 0.03, *Stage I vs Stage III + KPT 0.03. (D) Western Blot to show active β-catenin expression in whole pAVIC lysates cultured in complete media (CM), osteogenic media (OM), or OM in the presence of KPT-330. (E) Quantitation of Western Blot shown in (D) (n=3). *P-value using corrected Mann-Whitney: 0.07. (F) Luminescence as %RLU/mg in pAVICs transfected with TOP/FOP Flash plasmids and Renilla plasmid treated with DMSO or 100nM KPT-330 in OM. LiCl treatment was performed for 24 hours to activate Wnt signaling, *indicates comparison to TOP-Flash, #indicates comparison to DMSO (n=3). *P-value using corrected Mann-Whitney: OM vs OM+KPT (TOP-Flash) 0.03, OM (FOP-Flash) vs OM (TOP-Flash) 0.03, OM+KPT (FOP-Flash) vs OM+KPT (TOP-Flash) 0.03. (G) Immunofluorescent images of aortic valve annulus (highlighted) stained with β-catenin (red) and DAPI (blue) from Klotho−/− mice treated with vehicle or KPT-330. (H) Quantitation of β-catenin immunoreactivity (CTCF unit) in the annulus region of Klotho−/− mice treated with vehicle or KPT-330 (n=3). *P-value using corrected Mann-Whitney: 0.03. The Y axis indicates calibrated arbitrary units of area based on selected montages in Image J. (I) Western blot and densitometric analysis (J) of nuclear β-catenin expression in pAVICS treated with 2.5mM Pi in the absence and presence of 100nM KPT-330 (n=3). *P-value using corrected Mann-Whitney: 0.03. Molecular weights (MW) are indicated in kDa.

