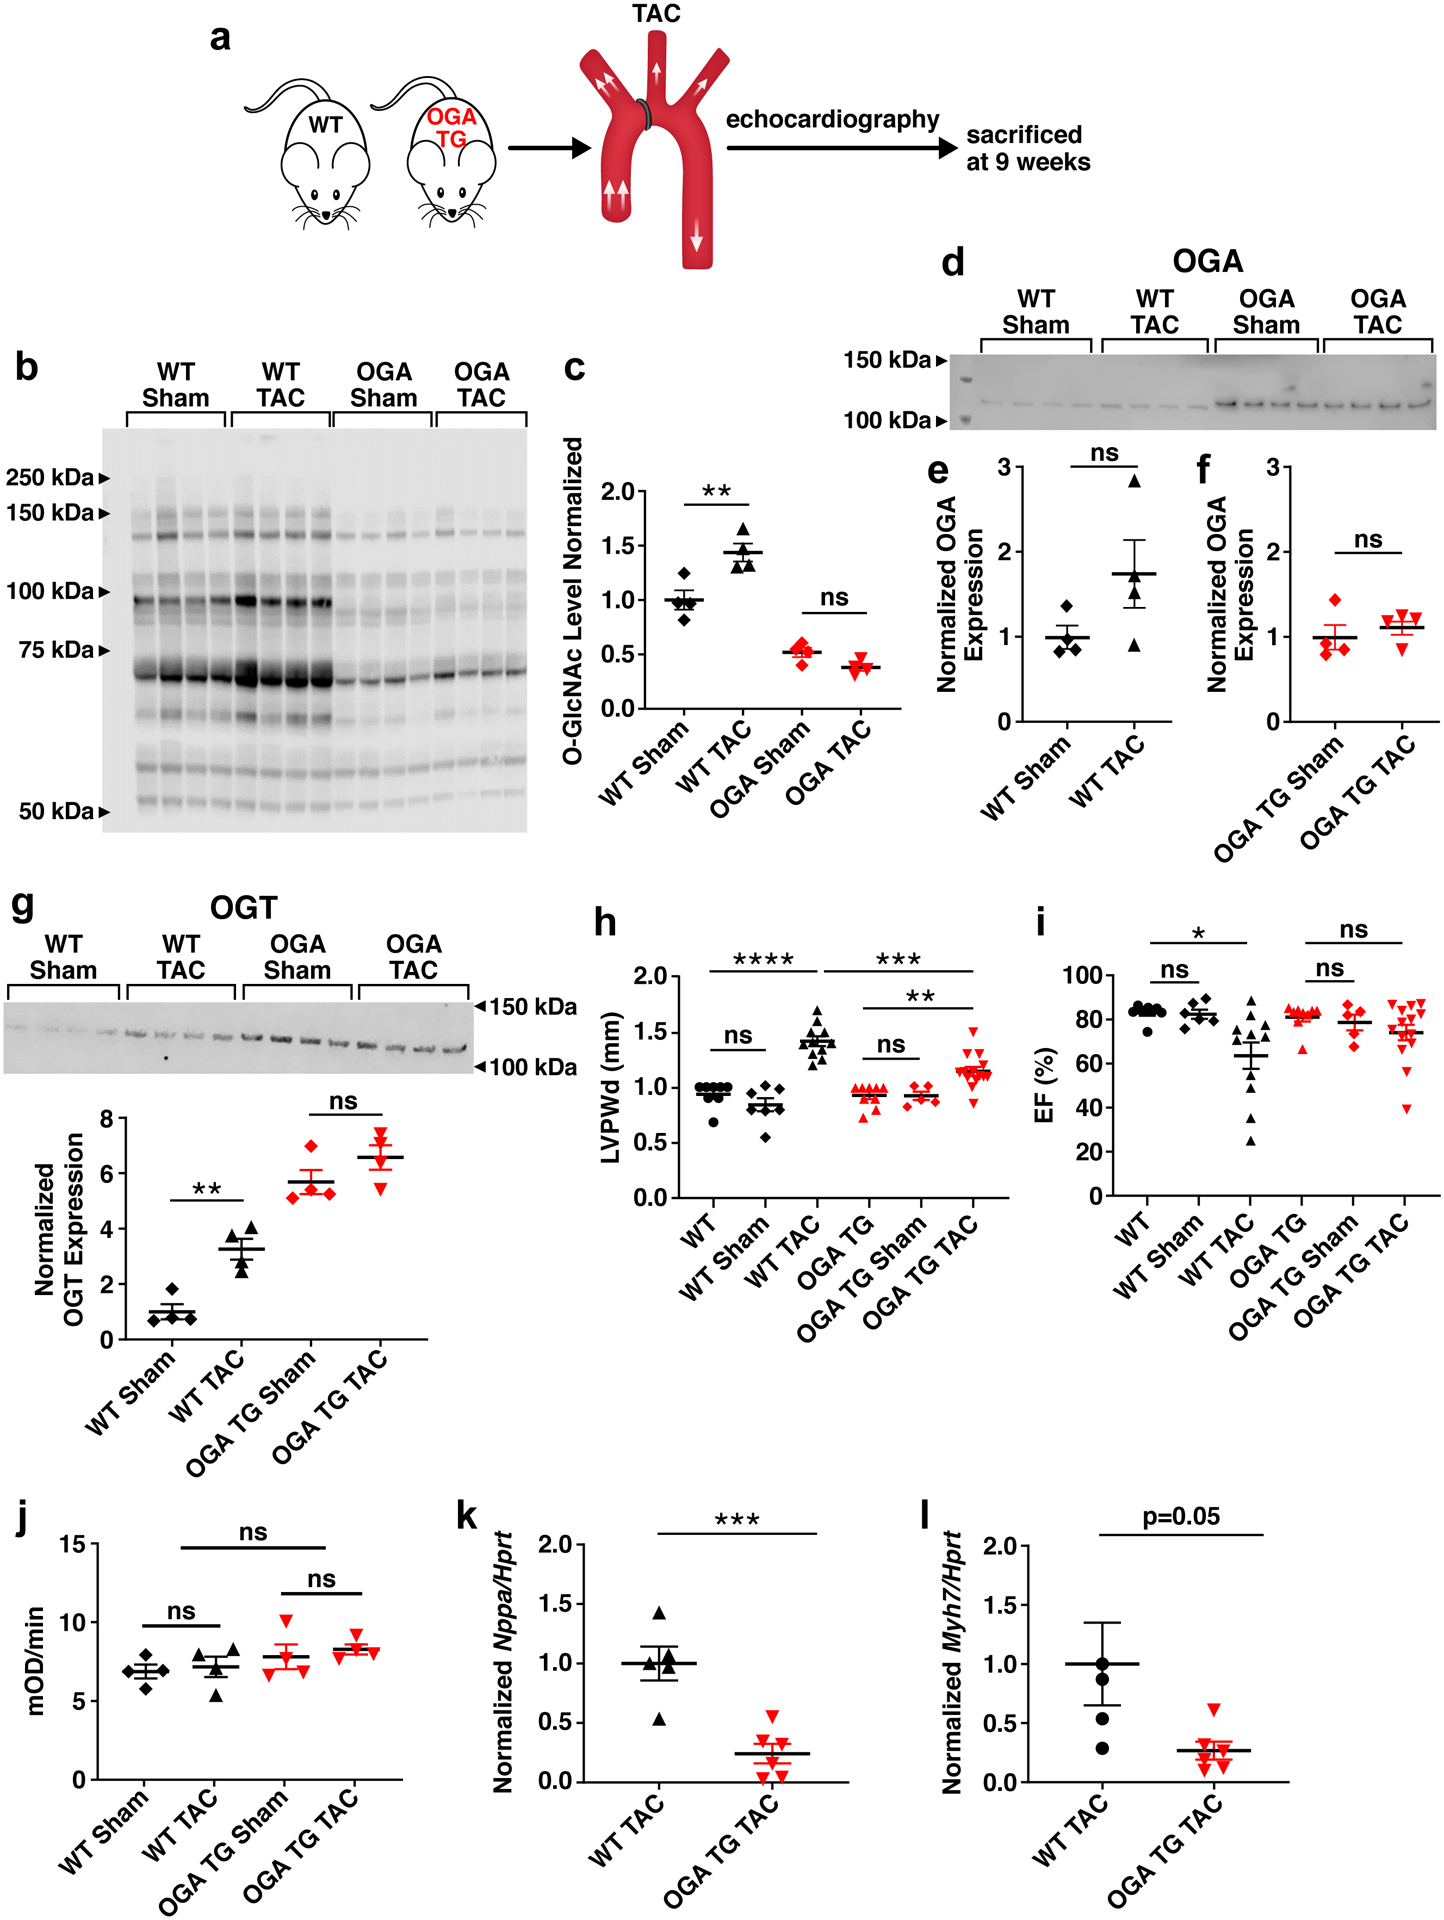
Figure 2. Myocardial-targeted OGA over-expression protects against left ventricular hypertrophy and contractile dysfunction after transverse aortic constriction (TAC) surgery.

a. Schematic of the TAC left ventricular pressure-overload model performed in 8–10 week old WT and OGA TG mice. b. Western blot and c. summary data of total O-GlcNAc levels from WT sham (n=4), WT TAC (n=4), OGA TG Sham (n=4) and OGA TG TAC (n=4) whole heart lysates 9 weeks after intervention. d. Western blot for OGA from whole heart lysates from OGA TG (Sham n =4, TAC n=4) and WT (Sham n=4, TAC n=4) mice, protein loading 25 ug WT mice, 0.25 ug OGA TG mice. e. Quantification OGA levels in WT sham and TAC. f. Quantification of OGA levels in OGA TG Sham and TAC. g. OGT protein expression and quantification h. left ventricular posterior wall thickness measured at end-diastole (LVPWd) in WT(baseline n=8, sham n =7, TAC n=11) and OGA TG (baseline n=9, sham n=5, TAC n=11) and i. Left ventricular ejection fractions (EF) in OGA TG and WT littermate hearts 9 weeks after TAC surgery. j. Complex I activity spectrophotometer assay summary data in WT (sham n=4, TAC n =4) and OGA TG (sham n=4, TAC n=4). k. Quantification of Nppa and l. Myh7 mRNA expression normalized to Hypoxanthine Peroxidase Reductase Transferase (Hprt) in OGA TG (n=6) and WT (n=5) hearts 9 weeks after TAC. Data are represented as mean ± SEM. Significance was determined using a two-tailed Student’s t test or 1 way ANOVA with Tukey’s multiple comparisons test, as appropriate (****P<0.0001, ***P<0.001, **P<0.01, *P<0.05, ns=not significant).
