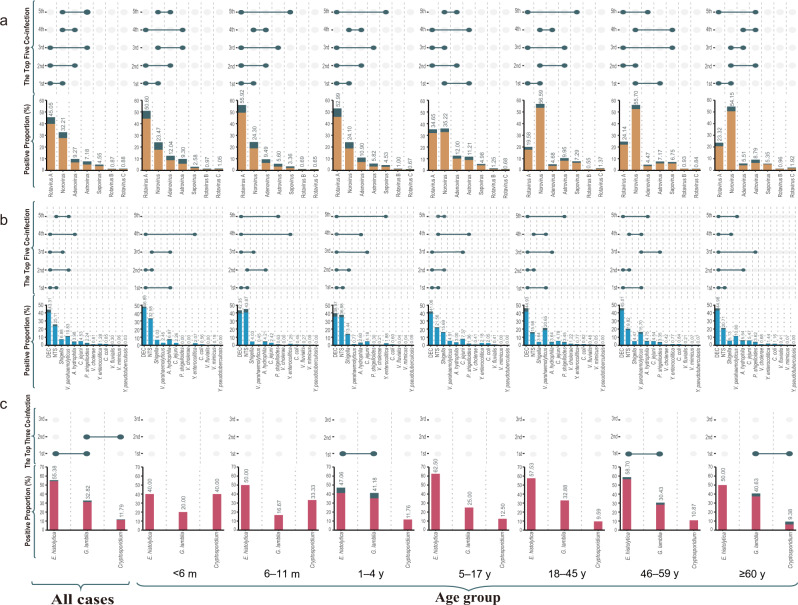
Fig. 2. Pathogen spectrum and co-infection pattern of enteropathogens in diarrhea patients by age group in the mainland of China, 2009‒2018.
a The viral spectrum and co-infection pattern of 58,620 patients with acute diarrhea who had all the seven viral pathogens tested. b The bacterial spectrum and co-infection pattern of 59,384 patients with acute diarrhea who had all the 13 bacterial pathogens tested. c The parasitical spectrum and co-infection pattern of 11,167 patients with acute diarrhea who had all three parasitical pathogens tested. The proportion of each positive pathogen was noted in % and by the length of colored bars. The orange bar indicates viral mono-infection; the blue bar indicates bacterial mono-infection; the red bar indicates parasitical mono-infection; the green bar indicates co-infection. For viruses, co-infection means co-infection among viruses. For bacteria, co-infection means co-infection among bacteria. For parasites, co-infection means co-infection among parasites. DEC diarrheagenic Escherichia coli; NTS nontyphoidal Salmonella. Source data are provided as a Source Data file.

